LEK is a set of tools which can take data from any source and search, analyze, and visualize it in real time. There are three tools as below:
L- Logstash: collect , enrich , transport data
E- ElasticSearch: search , analyse data in real time
K- Kibana: explore , visualize your data
Install LEK is easy, download the related software, then extract them(tar -zxvf), cd bin, ./xxx, last, you can use them.
1.Logstash: Download, Installation, usage
A Java runtime is required to run Logstash. We recommend running the latest version of Java. At a minimum, you need Java 7.
wget https://download.elastic.co/logstash/logstash/logstash-1.5.0.tar.gz
tar -zxvf logstash-1.5.0.tar.gz
cd logstash-1.5.0/bin
./logstash -e ‘input { stdin { } } output { stdout { codec => rubydebug } }‘  //-f: use config file
you also can use ‘-f‘ to run config file:
./logstash -f configFileName.conf
The configFileName.conf ‘s content like this:
input {
     stdin{}
}
output {
    elasticsearch { host => localhost }
    stdout { codec => rubydebug }
}
2.ElasticSearch: Download, Installation, usage
wget https://download.elastic.co/elasticsearch/elasticsearch/elasticsearch-1.6.0.tar.gz
tar -zxvf elasticsearch-1.6.0.tar.gz
cd elasticsearch-1.6.0/bin
./elasticsearch -d     //running on backend
3.Kibana: Download, Installation, usage
wget https://download.elastic.co/kibana/kibana/kibana-4.1.0-linux-x64.tar.gz
tar -zxvf kibana-4.1.0-linux-x64.tar.gz
cd kibana-4.1.0-linux-x64/bin
./kibana
The running sequence of LEK :
First, run elasticsearch, then use ‘jps‘ to see whether it is running
$ ./elasticsearch -d
$ jps

Second, you can run logstash, and connect it with elasticsearch
./logstash -e ‘input { stdin { } } output { elasticsearch { host => localhost } stdout { codec => rubydebug } }‘ //-f: use config file
Last, you can run kibana to search, view, and interact with data stored in Elasticsearch indices
./kibana
Note: Before you can start using Kibana, you need to tell it which Elasticsearch indices you want to explore. By default, Kibana connects to the Elasticsearch instance running on localhost.
To connect to a different Elasticsearch instance, modify the Elasticsearch URL in thekibana.yml configuration file and restart Kibana. For information about using Kibana with your production nodes, see
https://www.elastic.co/guide/en/kibana/current/production.html
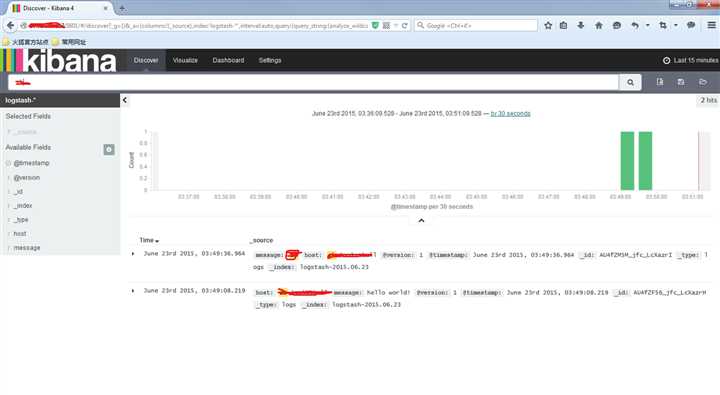
The Final portal : Input your (IP:5601) on your brower
The Logstash event processing pipeline has three stages: inputs → filters → outputs.
You use inputs to get data into Logstash.
Filters are intermediary processing devices in the Logstash pipeline. You can combine filters with conditionals to perform an action on an event if it meets certain criteria. Some useful filters include:
Outputs are the final phase of the Logstash pipeline. An event can pass through multiple outputs, but once all output processing is complete, the event has finished its execution.
For more info, this is link: https://www.elastic.co/guide/en/logstash/current/pipeline.html
原文:http://www.cnblogs.com/zbhdsfdx-2015/p/4595661.html