很久以前写的一段代码。医学院某个实验室有一系列电子显微镜拍摄的细胞照片,他们需要人工统计每张图片里细胞的数目,对比前后照片来分析药物对组织产生的影响。人工计数的工作量太庞大了,于是他们找我们实验室合作。
这个问题本质上就是一个图像分割的问题,把照片中的每个细胞分割开,然后求一下连通域的个数就好。
% input image ---> tophat/bottomhat filter ---> image enhancement--->binarization by a histogram based threshold
%  ---> calculate seed points ---> segmentation or plot edges of blobs ---> count connected components
整个流程比较简单,图像预处理,调整亮度和对比度,区域分割,然后是连通域处理。用Matlab实现的,代码全都贴在这里了。这是实验阶段,后来又用OpenCVS和Qt写了一个简单的包含图形界面的程序给他们使用,如果有需要的同学可以邮件联系。
function [outputImage, number_of_nuclei] = nuclei_counter(sourceImage, threshold)
% This script accept an input nuclei image taken under microscope,
% then preprocess the image with tophat and bottomhat filter, enhance its
% contrast by multiplying gamma. Convert it to binary image with a histogram
% based threshold, count the number of connected components and detect edges
% of nucleus with LoG filter, then plot edges. Or calculate distance transform
% and detect seed points,use watershed algorithm for segmentation.
%
% flow chart:
% input image ---> tophat/bottomhat filter ---> image enhancement--->binarization by a histogram based threshold
%  ---> calculate seed points ---> segmentation or plot edges of blobs ---> count connected components
%
% refrence:
% * Yousef Al-Kofahi, et al. Improved Automatic Detection and Segmentation of Cell Nuclei in Histopathology Images.
%   IEEE TRANSACTIONS ON BIOMEDICAL ENGINEERING, VOL. 57, NO. 4, APRIL 2010
% * Jos B.T.M, et al, The Watershed Transform: Defnitions, Algorithms and Parallelization Strategies
%   Fundamenta Informaticae 41 (2001) 187{228
%
% Input
%     sourceImage: 8 bits grayscale image;
%     threshold: threshold [0 1] for binarization.
%
% Output:
%     outputImage: source image with overlayed contour
%     number_of_nuclei: number of nucleis in image
%
% If you have any ideas or improvements about this method, welcome to contact me ‘zhyh8341@gmail.com‘.


% display original image
image = sourceImage;
figure;imshow(image);
title(‘input image‘);

total = numel(image);


% apply top hat and bottom hat filter
se = strel(‘disk‘,30);
tophat = imtophat(image,se);
bottomhat = imbothat(image,se);
filterImage = image + (tophat - bottomhat);
se = strel(‘disk‘,15);
tophat = imtophat(filterImage,se);
bottomhat = imbothat(filterImage,se);
filterImage = filterImage + (tophat - bottomhat);

% calculate histogram of filtered image
% estimate more than 78.5% area is background (pi/4 = .785)
[counts,x] = imhist(filterImage);
ssum = cumsum(counts);
bg = .215*total;
fg = .99*total;
low = find(ssum>bg, 1, ‘first‘);
high = find(ssum>fg, 1, ‘first‘);
adjustedImage = imadjust(filterImage, [low/255 high/255],[0 1],1.8);


% image binarization, threshold is choosen based on experience
if(nargin < 2)
    matrix = reshape(adjustedImage,total,1);
    matrix = sort(matrix);
    threshold = graythresh(matrix(total*.5:end));
end
binarization = im2bw(adjustedImage,threshold);


% open image and then detect edge using laplacian of gaussian
se2 = strel(‘disk‘,5);
afterOpening = imopen(binarization,se2);
nsize = 5; sigma = 3;
h = fspecial(‘log‘,nsize,sigma);
afterLoG = uint8(imfilter(double(afterOpening)*255,h,‘same‘).*(sigma^2));


se2 = strel(‘disk‘,5);
afterOpening = imopen(binarization,se2);
number_of_nuclei = bwconncomp(afterOpening);


% % you can either use watershed method to do segmentation
% D = -bwdist(~afterOpening);
% D(~afterOpening) = -Inf;
% L = watershed(D);


outputImage = sourceImage + afterLoG*5;
figure;imshow(outputImage);
title(‘output image‘);
一个简单的例子:
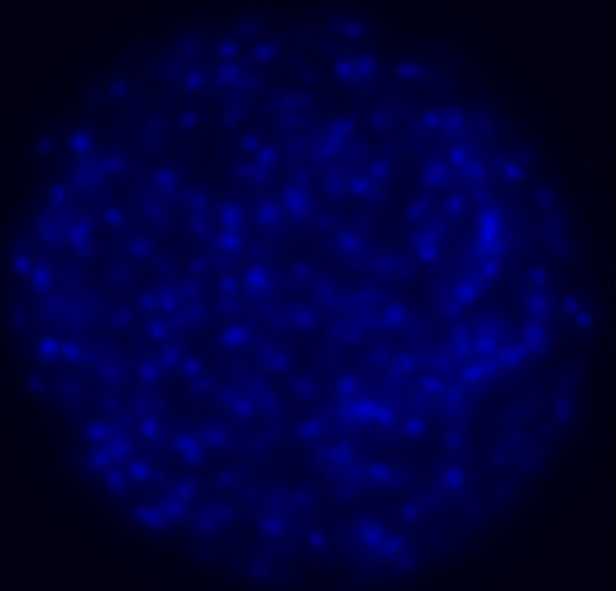
% this is just an example to show how to use this function

% read an image
I = imread(‘img01.JPG‘);

% convert it to grayscale of just take one channel
% Igray = rgb2gray(I);
Iblue = I(:,:,3);

% call the nuclei counter function
[outputImage, number_of_nuclei] = nuclei_counter(Iblue);
效果如下:
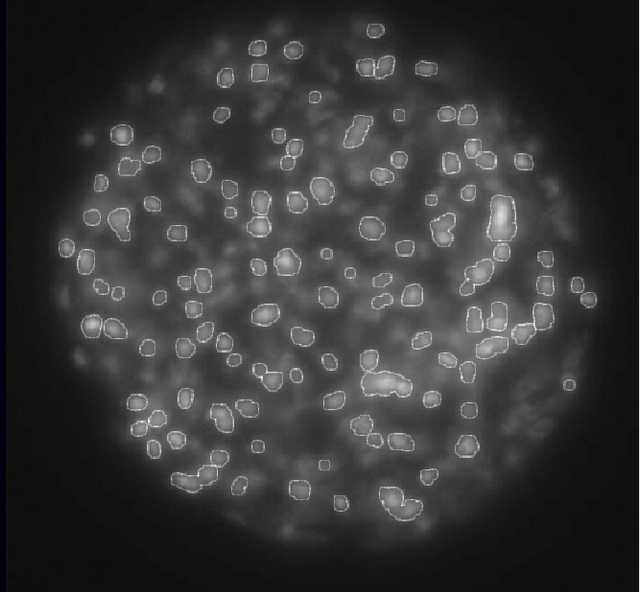
原文:http://www.cnblogs.com/naive/p/4216791.html