> dataset = matrix(c(1,2,
+ 1.2,2,
+ 8,9,
+ 0.9,1.8,
+ 7,10,
+ 8.8,9.2), nrow=6, byrow=T)
> dataset
     [,1] [,2]
[1,]  1.0  2.0
[2,]  1.2  2.0
[3,]  8.0  9.0
[4,]  0.9  1.8
[5,]  7.0 10.0
[6,]  8.8  9.2
> kmeans(dataset, 2, iter.max = 20)
K-means clustering with 2 clusters of sizes 3, 3

Cluster means:
      [,1]     [,2]
1 1.033333 1.933333
2 7.933333 9.400000

Clustering vector:
[1] 1 1 2 1 2 2

Within cluster sum of squares by cluster:
[1] 0.07333333 2.18666667
 (between_SS / total_SS =  98.6 %)

Available components:

[1] "cluster"      "centers"      "totss"        "withinss"     "tot.withinss" "betweenss"
[7] "size"
Cluster means:
      [,1]     [,2]
1 1.033333 1.933333
2 7.933333 9.400000
6个数据的簇标号分别是:
Clustering vector:
[1] 1 1 2 1 2 2
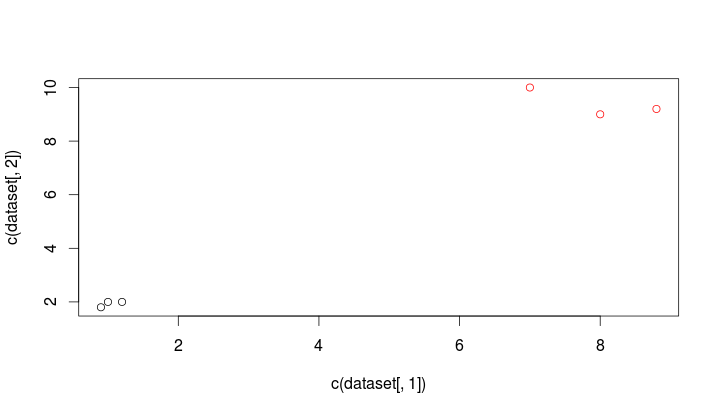
> result = kmeans(dataset, 2, iter.max = 20)
> plot(c(dataset[,1]), c(dataset[,2]), col=result$cluster)
原文:http://my.oschina.net/letiantian/blog/324317