Elasticsearch提供了许多指标,可以帮助您检测故障迹象并在遇到不可靠的节点,内存不足的错误以及较长的垃圾收集时间等问题时采取措施。需要监视的几个关键领域是:
进入 DataKit 安装目录下的 conf.d/db 目录,复制 elasticsearch.conf.sample 并命名为 elasticsearch.conf。示例如下:
 [[inputs.elasticsearch]]

  ## specify a list of one or more Elasticsearch servers
  # you can add username and password to your url to use basic authentication:
  # servers = ["http://user:pass@localhost:9200"]
  servers = ["http://localhost:9200"]

  ## Timeout for HTTP requests to the elastic search server(s)
  http_timeout = "5s"

  ## When local is true (the default), the node will read only its own stats.
  ## Set local to false when you want to read the node stats from all nodes
  ## of the cluster.
  local = true

  ## Set cluster_health to true when you want to also obtain cluster health stats
  cluster_health = true

  ## Adjust cluster_health_level when you want to also obtain detailed health stats
  ## The options are
  ##  - indices (default)
  ##  - cluster
  # cluster_health_level = "cluster"

  ## Set cluster_stats to true when you want to also obtain cluster stats.
  cluster_stats = true

  ## Only gather cluster_stats from the master node. To work this require local = true
  cluster_stats_only_from_master = true

  ## Indices to collect; can be one or more indices names or _all
  indices_include = ["_all"]

  ## One of "shards", "cluster", "indices"
  indices_level = "shards"

  ## node_stats is a list of sub-stats that you want to have gathered. Valid options
  ## are "indices", "os", "process", "jvm", "thread_pool", "fs", "transport", "http",
  ## "breaker". Per default, all stats are gathered.
  node_stats = ["jvm", "http","indices","os","process","thread_pool","fs","transport"]

  ## HTTP Basic Authentication username and password.
  # username = ""
  # password = ""

  ## Optional TLS Config
  # tls_ca = "/etc/telegraf/ca.pem"
  # tls_cert = "/etc/telegraf/cert.pem"
  # tls_key = "/etc/telegraf/key.pem"
  ## Use TLS but skip chain & host verification
  # insecure_skip_verify = false
重新启动datakit生效
systemctl restart datakit
进入 DataKit 安装目录下的 conf.d/log 目录,复制 tailf.conf.sample 并命名为 tailf.conf。示例如下:
[[inputs.tailf]]
    # glob logfiles
    # required
    logfiles = ["/var/log/elasticsearch/solution.log"]

    # glob filteer
    ignore = [""]

    # required
    source = "es_clusterlog"

    # grok pipeline script path
    pipeline = "elasticsearch_cluster_log.p"

    # read file from beginning
    # if from_begin was false, off auto discovery file
    from_beginning = true

    ## characters are replaced using the unicode replacement character
    ## When set to the empty string the data is not decoded to text.
    ## ex: character_encoding = "utf-8"
    ##     character_encoding = "utf-16le"
    ##     character_encoding = "utf-16le"
    ##     character_encoding = "gbk"
    ##     character_encoding = "gb18030"
    ##     character_encoding = ""
    # character_encoding = ""

    ## The pattern should be a regexp
    ## Note the use of ‘‘‘XXX‘‘‘
    # match = ‘‘‘^\d{4}-\d{2}-\d{2}‘‘‘

	#Add Tag for elasticsearch cluster
    [inputs.tailf.tags]
      cluster_name = "solution"
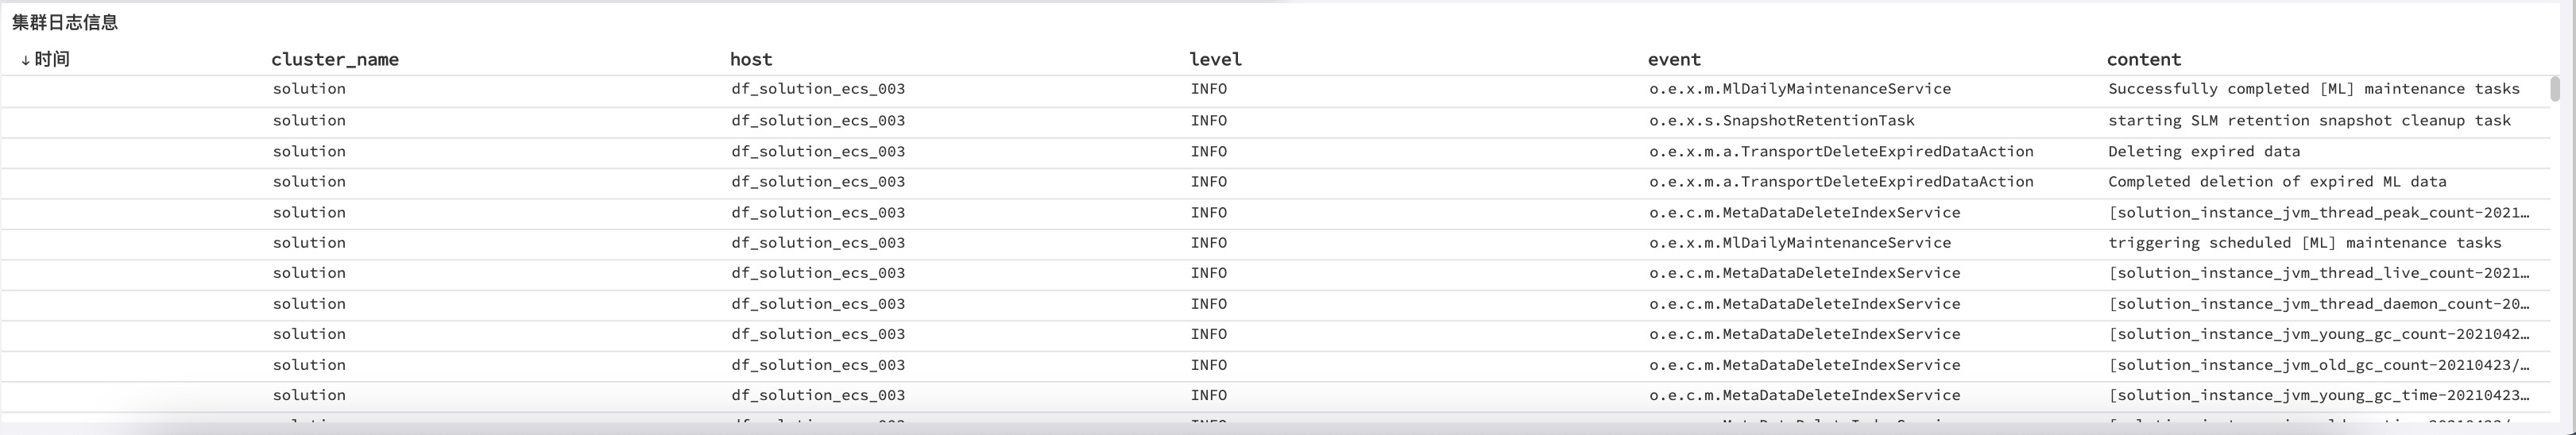
Elasticsearch集群信息日志切割grok脚本
重新启动datakit生效
systemctl restart datakit
|
指标描述 |
名称 |
度量标准 |
|
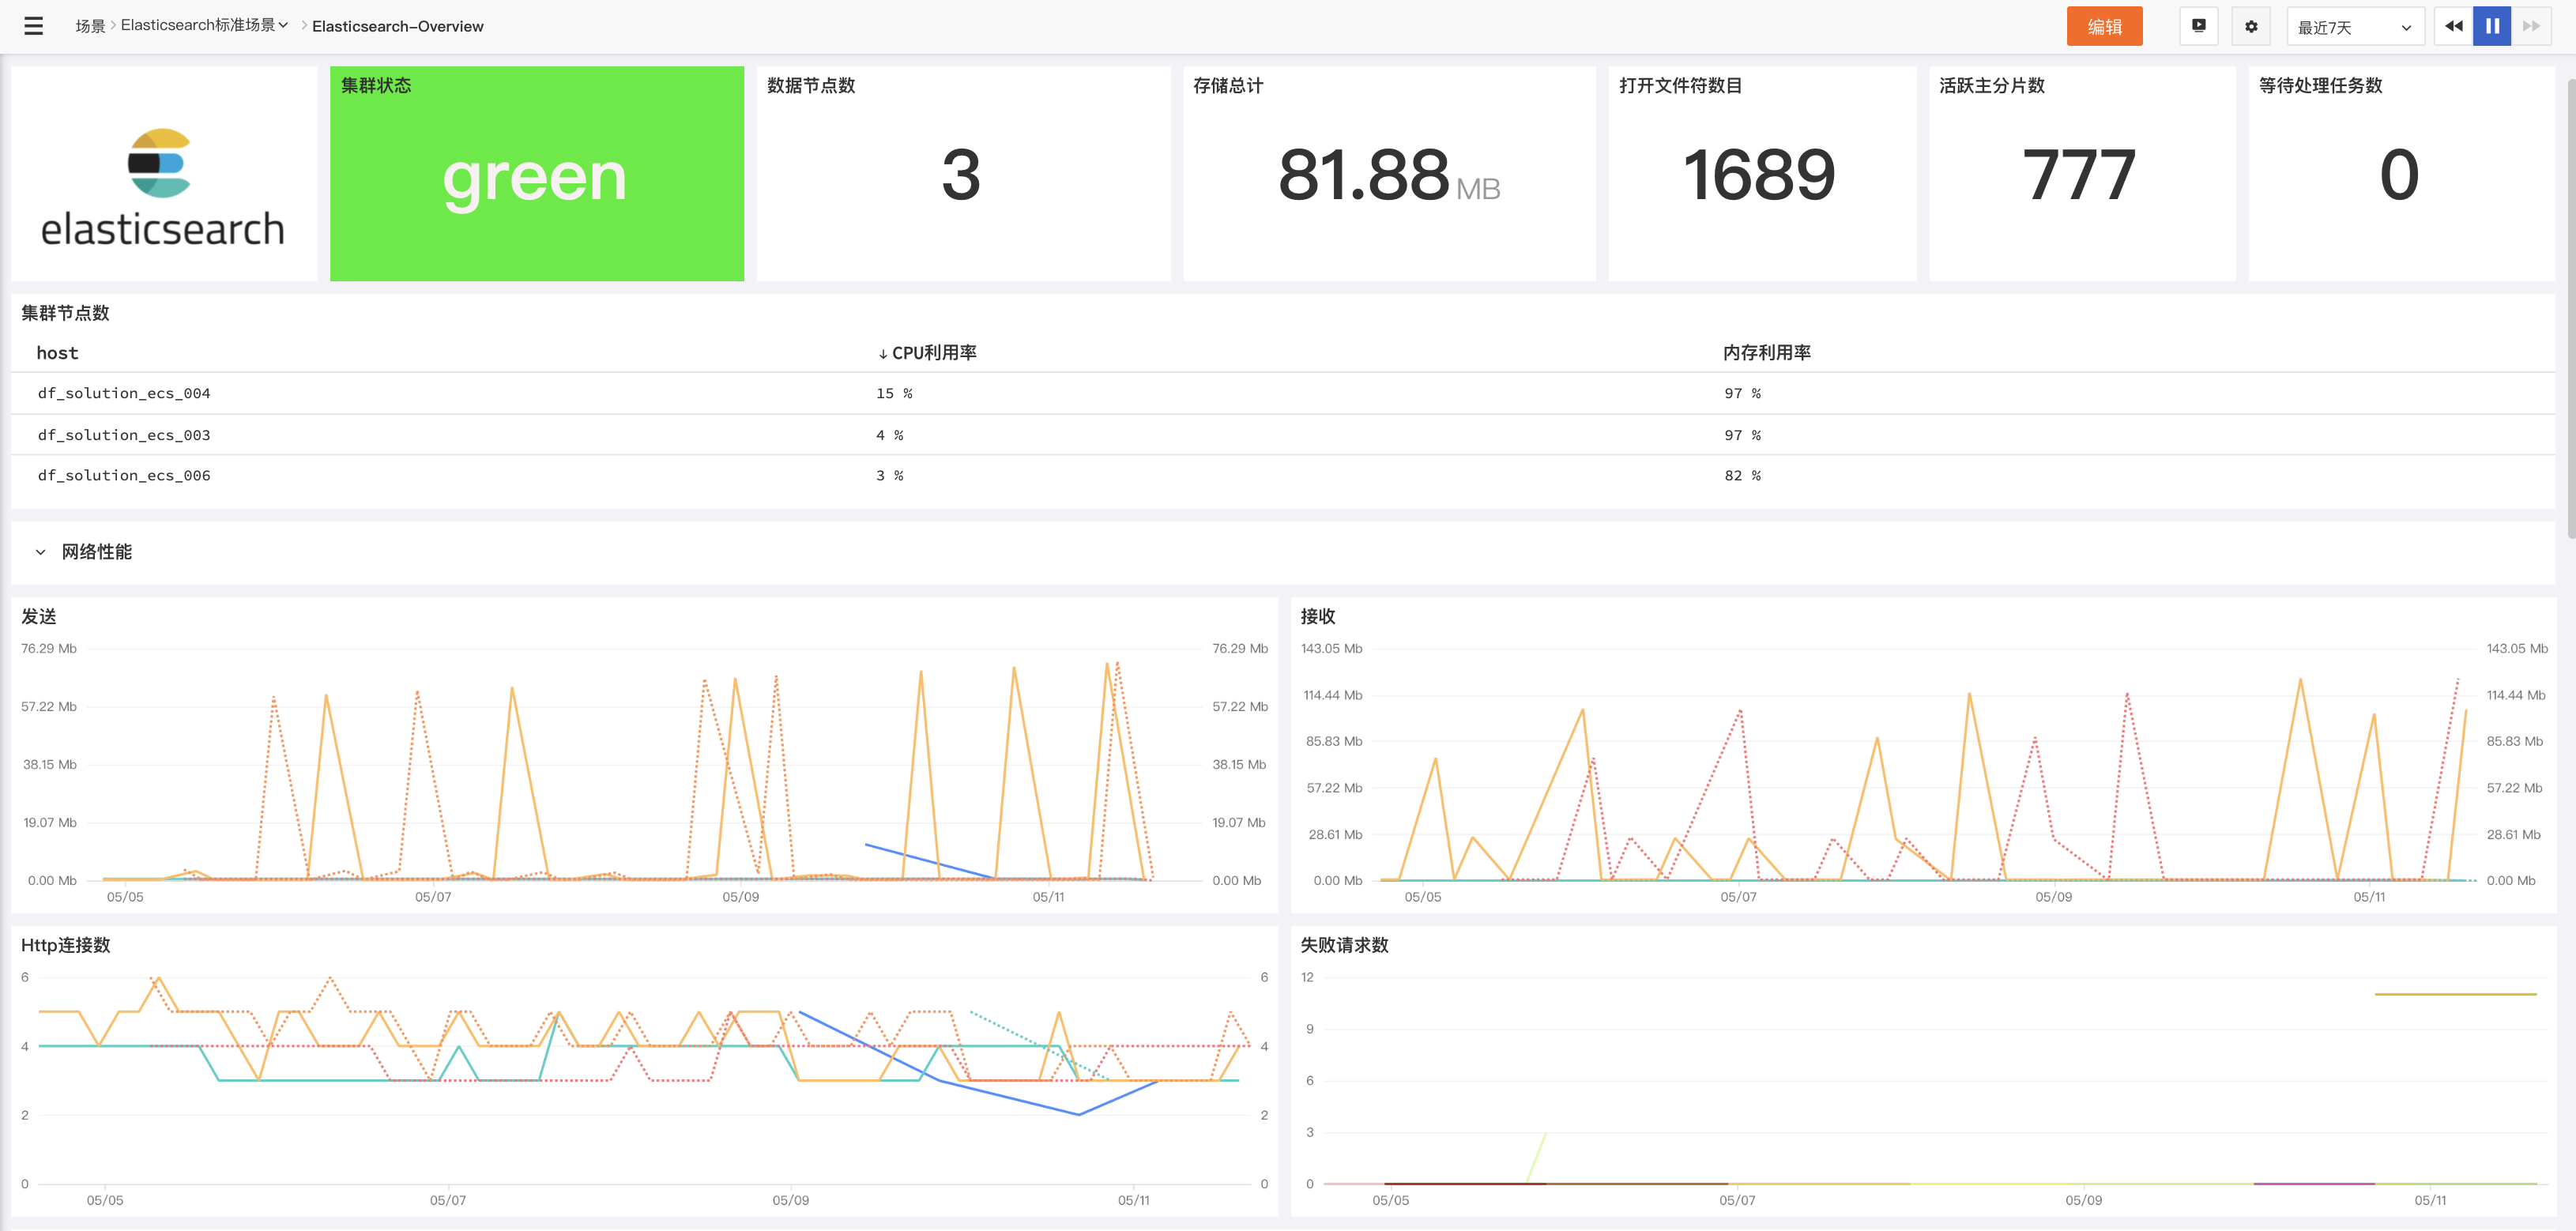
集群状态(绿色,黄色,红色 |
|
其他 |
|
数据节点数 |
|
可用性 |
|
初始化分片数 |
|
可用性 |
|
未分配分片数 |
|
可用性 |
|
活跃分片数 |
|
可用性 |
|
迁移中的分片数 |
|
可用性 |
集群运行状况和节点可用性的要点
|
指标描述 |
名称 |
度量标准 |
|
可用磁盘空间 |
|
资源利用率 |
|
内存利用率 |
|
资源利用率 |
|
CPU使用率 |
|
资源利用率 |
|
网络字节发送/接收 |
|
资源利用率 |
|
打开文件描述符 |
|
资源利用率 |
|
HTTP链接数 |
|
资源利用率 |
主机的网络和系统的要点
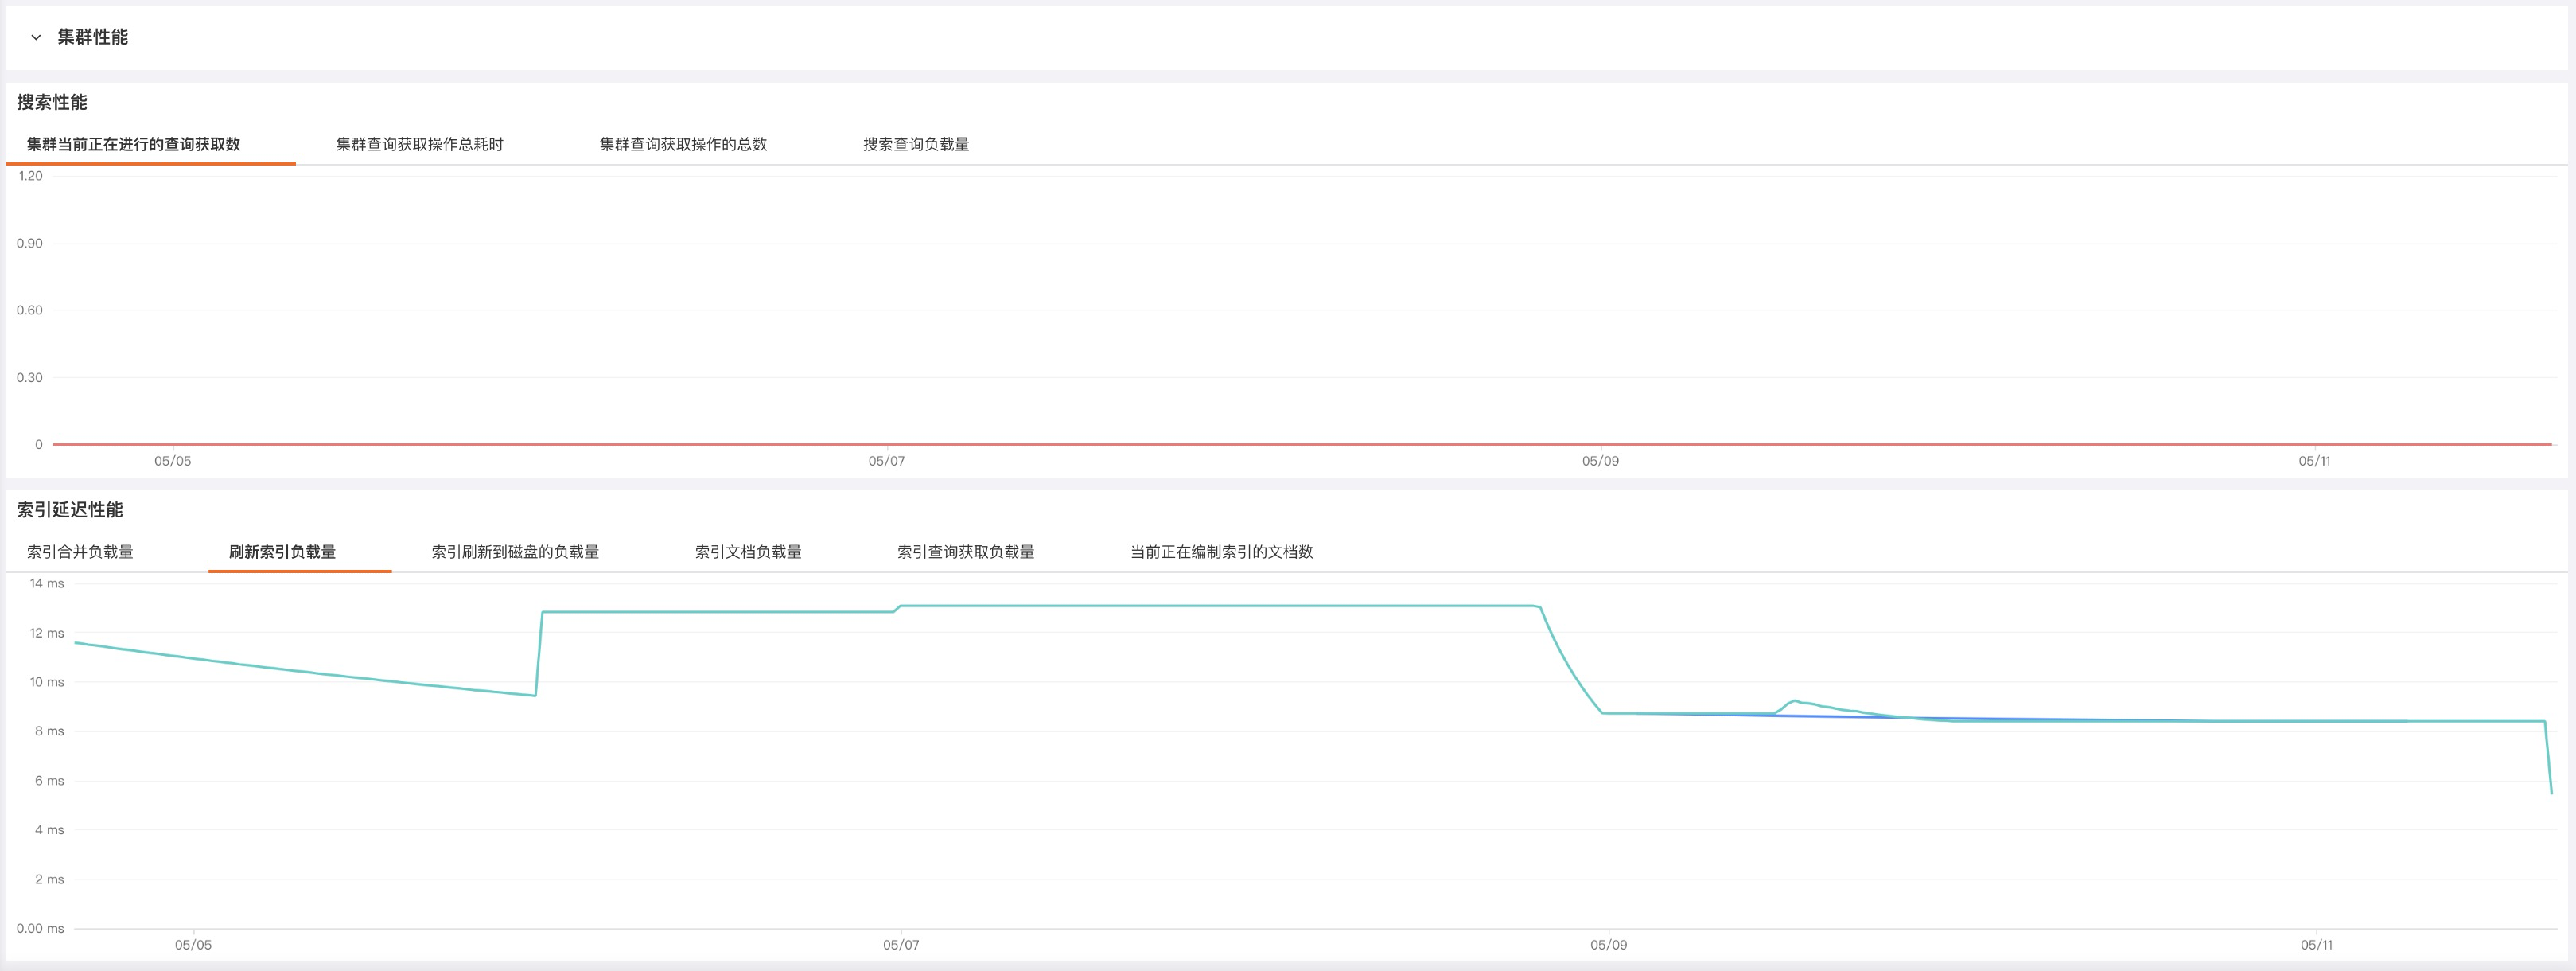
如果您主要使用 Elasticsearch 进行查询,那么您应该关注查询延迟并在超出阈值时采取措施。监控 Query 和 Fetch 的相关指标可以帮助您跟踪查询在一段时间内的执行情况。例如,您可能需要跟踪查询曲线的峰值以及长期的查询请求增长趋势,以便可以优化配置来获得更好的性能和可靠性。
|
指标描述 |
名称 |
度量标准 |
|
集群查询操作的总数 |
|
吞吐量 |
|
集群查询操作总耗时 |
|
性能表现 |
|
集群当前正在进行的查询数 |
|
吞吐量 |
|
集群获取操作的总数 |
|
吞吐量 |
|
集群获取操作总耗时 |
|
性能表现 |
|
集群当前正在进行的获取数 |
|
吞吐量 |
搜索性能指标的要点:
索引(Indexing)请求类似于传统数据库里面的写操作。如果您的 Elasticsearch 集群是写负载类型的,那么监控和分析索引(indices)更新的性能和效率就变得很重要。在讨论这些指标之前,我们先看一下 Elasticsearch 更新索引的过程。如果索引发生了变化(比如新增了数据、或者现有数据需要更新或者删除),索引的每一个相关分片都要经历如下两个过程来实现更新操作:refresh 和 flush。
|
指标描述 |
名称 |
度量标准 |
|
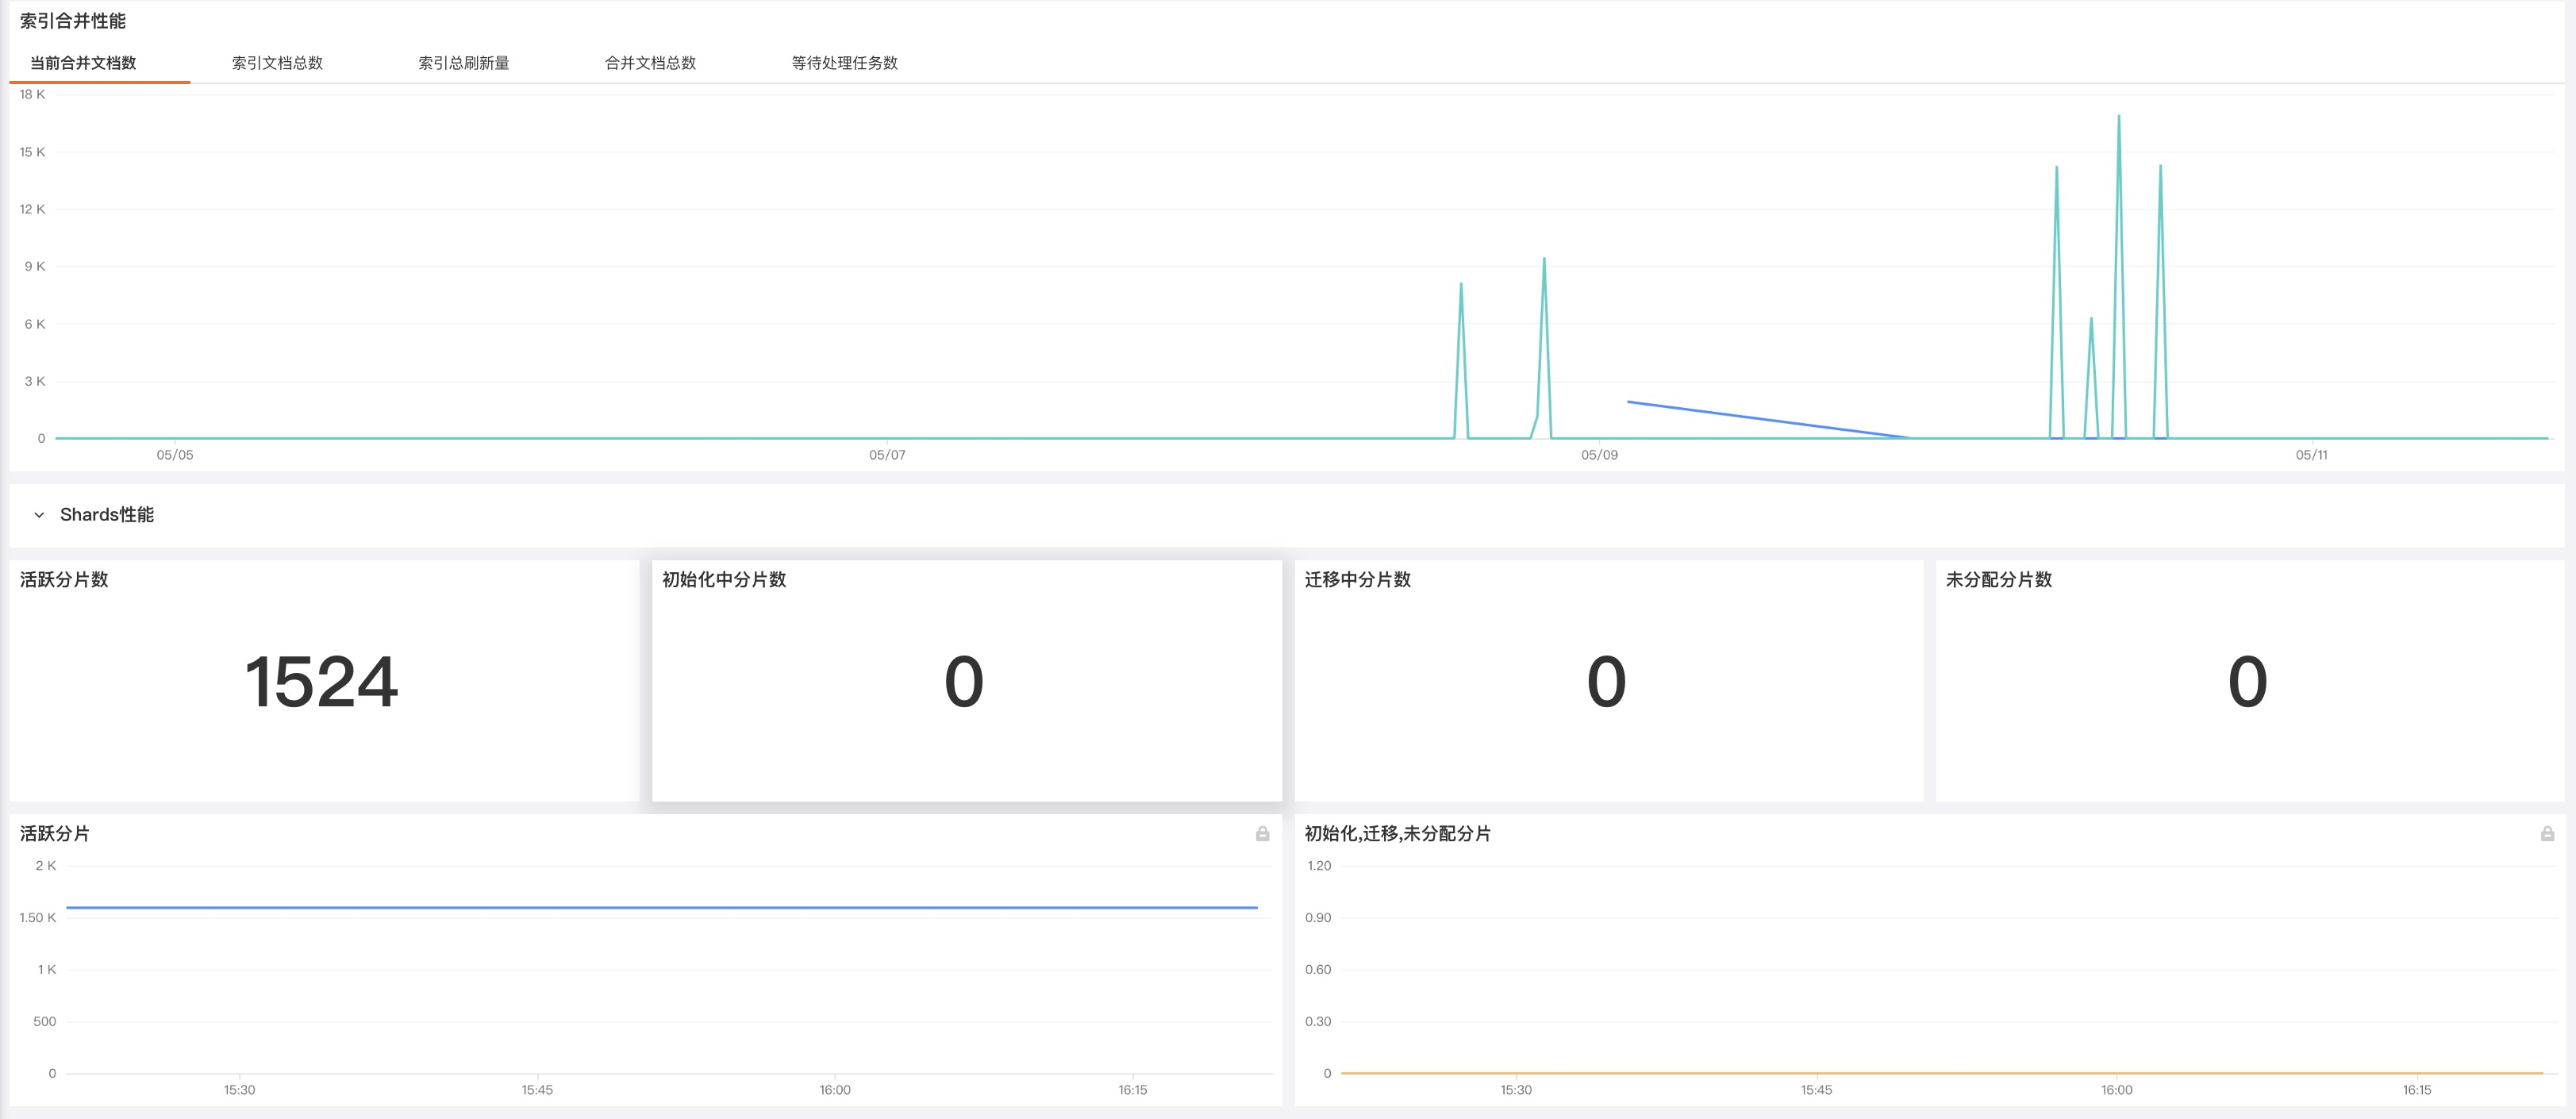
索引的文档总数 |
|
吞吐量 |
|
索引文档花费的总时间 |
|
性能表现 |
|
索引平均获取延迟 |
|
性能表现 |
|
索引平均查询延迟 |
|
性能表现 |
|
当前正在编制索引的文档数 |
|
吞吐量 |
|
索引刷新总数 |
|
吞吐量 |
|
刷新索引所花费的总时间 |
|
性能表现 |
|
刷新到磁盘的索引总数 |
|
吞吐量 |
|
将索引刷新到磁盘上花费的总时间 |
|
性能表现 |
|
索引合并文档数 |
|
吞吐量 |
|
索引合并花费时间 |
|
性能表现 |
|
等待处理任务数 |
|
吞吐量 |
索引性能指标的要点:
在 Elasticsearch 运行过程中,内存是需要密切关注的关键资源之一。Elasticsearch 和 Lucene 以两种方式利用节点上的所有可用 RAM:JVM 堆和文件系统缓存。 Elasticsearch 运行在 Java 虚拟机(JVM)上,这意味着 JVM 垃圾回收的持续时间和频率将是其他重要的监控领域。
|
指标描述 |
名称 |
度量标准 |
|
青年代垃圾收集数 |
|
- |
|
老年代垃圾收集数 |
|
- |
|
年轻代垃圾收集总时间 |
|
- |
|
老年代垃圾收集总时间 |
|
- |
|
当前JVM堆内存的百分比 |
|
资源利用率 |
|
提交的JVM堆内存大小 |
|
资源利用率 |
内存使用和GC指标的要点:
Elasticsearch 节点使用线程池来管理线程对内存和 CPU 使用。由于线程池是根据处理器的核数自动配置的,因此调整它们通常是没有意义的。 但是通过请求队列和请求被拒绝的情况,来确定你的节点是否够用是一个不错的主意。如果出现了状况,您可能需要添加更多的节点来处理所有的并发请求。
|
指标描述 |
名称 |
度量标准 |
|
线程池中排队的线程数 |
|
饱和度 |
|
线程池中被拒绝的线程数 |
|
错误 |
资源饱和度和错误的要点:
Elasticsearch可观测最佳实践分享!3分钟带你快速入门!
原文:https://www.cnblogs.com/DataFlux/p/15242361.html