目录结构,需要ec-canvas文件夹,然后在chart.js中引入
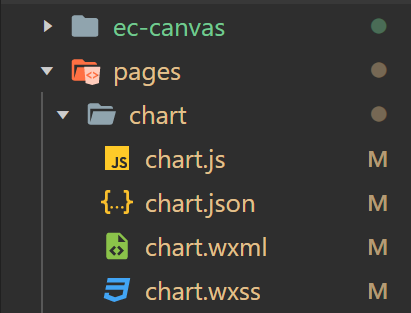
chart.js:
import * as echarts from ‘../../ec-canvas/echarts‘;

function initChart(canvas, width, height, dpr) {
  const chart = echarts.init(canvas, null, {
    width: width,
    height: height,
    devicePixelRatio: dpr // new
  });
  canvas.setChart(chart);

  let option = {
    xAxis: {
        type: ‘category‘,
        data: [‘Mon‘, ‘Tue‘, ‘Wed‘, ‘Thu‘, ‘Fri‘, ‘Sat‘, ‘Sun‘]
    },
    yAxis: {
        type: ‘value‘
    },
    series: [{
        data: [150, 230, 224, 218, 135, 147, 260],
        type: ‘bar‘
    }]
  };

  chart.setOption(option);
  return chart;
}

Page({
  data: {
    ec: {
      onInit: initChart
    }
  }
});
<view class="container">
  <view class="my-chart">
    <ec-canvas id="mychart-dom-recite" canvas-id="mychart-recite" ec="{{ec}}"></ec-canvas>
  </view>
</view>
与最基本有什么差异呢?
到时候可以在onLoad中执行init前调用接口获取数据,传递进去,再展示
import * as echarts from ‘../../ec-canvas/echarts‘;

Page({
  data: {
    ec: {
      // 将 lazyLoad 设为 true 后,需要手动初始化图表
      lazyLoad: true
    }
  },
  onLoad: function () {
    // 获取组件
    this.ecComponent = this.selectComponent(‘#mychart-dom-recite‘);
    this.init();
  },

  // 点击按钮后初始化图表
  init() {
    this.ecComponent.init((canvas, width, height, dpr) => {
      // 获取组件的 canvas、width、height 后的回调函数
      // 在这里初始化图表
      const chart = echarts.init(canvas, null, {
        width: width,
        height: height,
        devicePixelRatio: dpr // new
      });
      setOption(chart);

      // 将图表实例绑定到 this 上,可以在其他成员函数中访问
      this.chart = chart;

      return chart;
    });
  }
});

function setOption(chart) {
  let option = {
    xAxis: {
        type: ‘category‘,
        data: [‘Mon‘, ‘Tue‘, ‘Wed‘, ‘Thu‘, ‘Fri‘, ‘Sat‘, ‘Sun‘]
    },
    yAxis: {
        type: ‘value‘
    },
    series: [{
        data: [150, 230, 224, 218, 135, 147, 260],
        type: ‘bar‘
    }]
  };
  chart.setOption(option);
}
原文:https://www.cnblogs.com/lwxx/p/14616820.html