地址:https://github.com/prometheus-operator/kube-prometheus
https://blog.csdn.net/choerodon/article/details/98587027
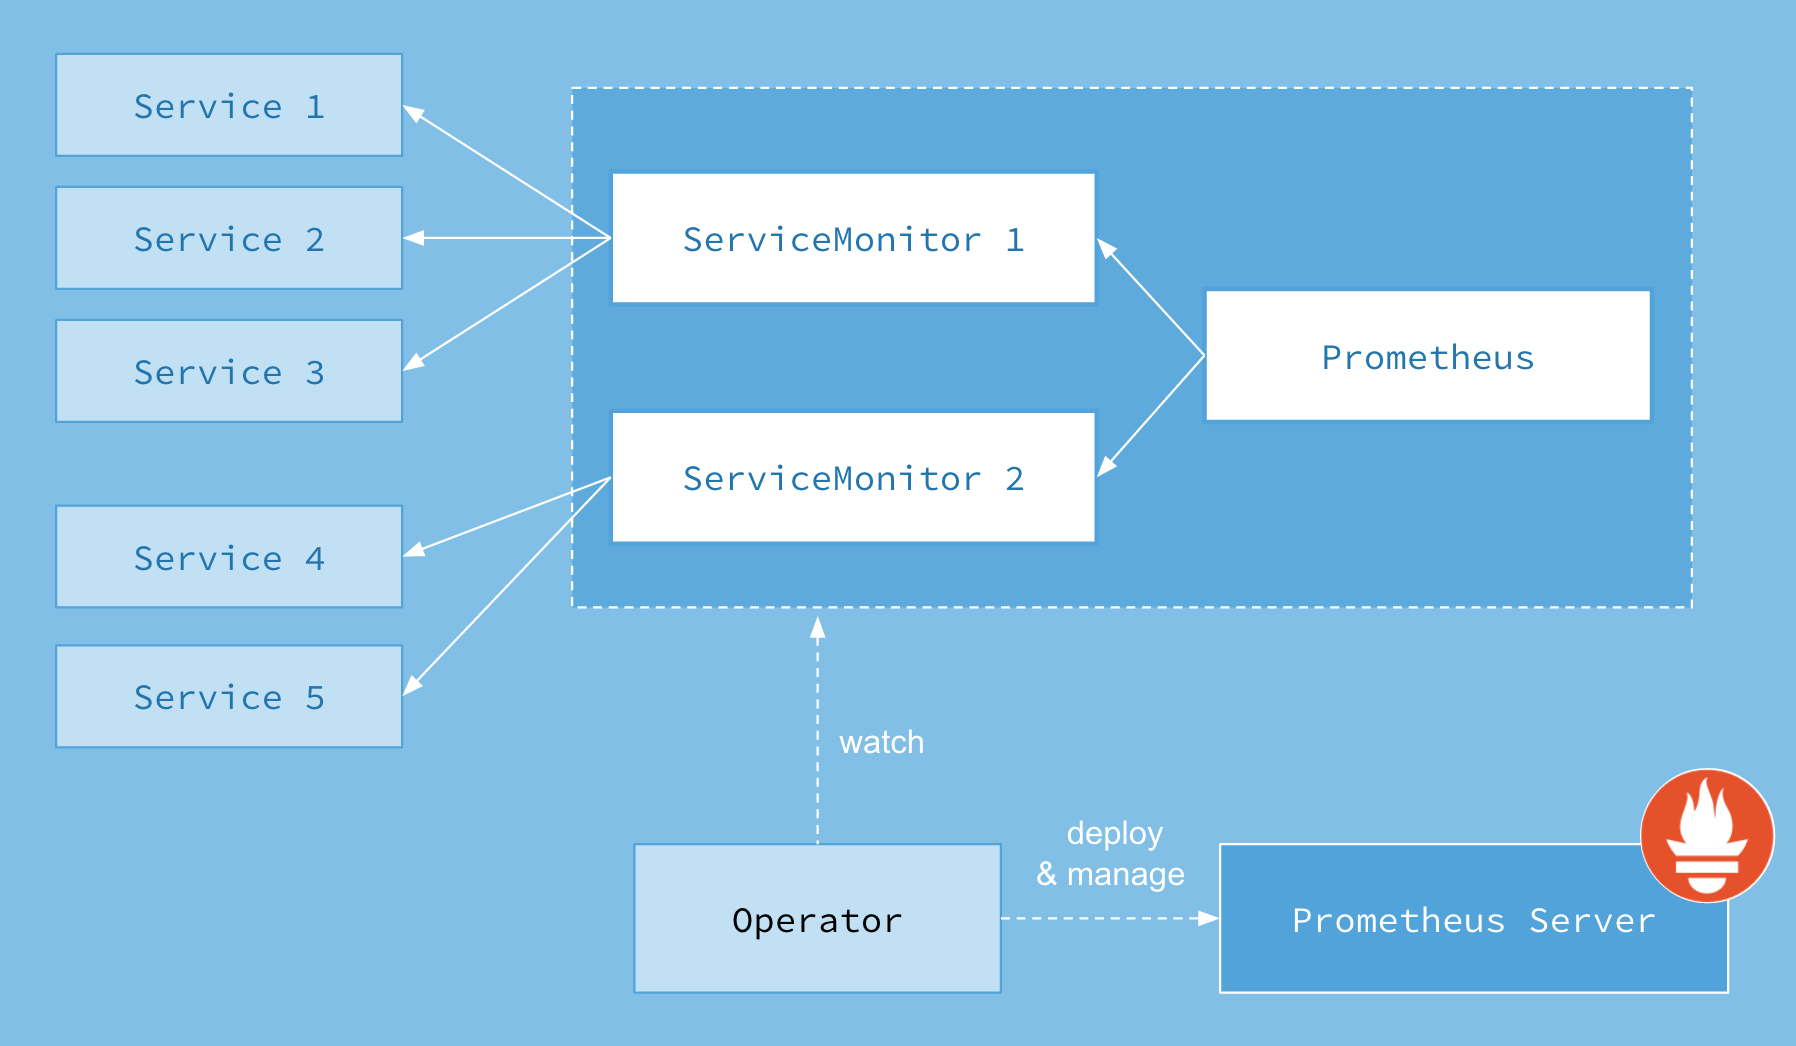
Prometheus Operator架构图:
Prometheus Operator部署很简单
# 下载
# git clone https://github.com/prometheus-operator/kube-prometheus.git
?
# cd kube-prometheus
?
# 安装operator
# kubectl create -f manifests/setup
?
# 安装prometheus
kubectl create -f manifests/
可以在replicas定义启动个数
查看
# kubectl get pods -n monitoring
NAME                                   READY   STATUS    RESTARTS   AGE
alertmanager-main-0                    2/2     Running   10         8d
blackbox-86b7486879-w6n22              1/1     Running   0          18h
grafana-5cb8d5c55b-wplg4               1/1     Running   5          8d
kafka-exporter-5cf8fdd8f8-c4j5t        1/1     Running   0          20h
kube-state-metrics-65f69f9759-spcr6    3/3     Running   27         8d
node-exporter-rdjl9                    2/2     Running   2          24h
prometheus-adapter-865cc8dbcd-bc7v6    1/1     Running   34         8d
prometheus-k8s-0                       2/2     Running   3          76m
prometheus-operator-56d44459f7-vt2l9   2/2     Running   15         8d
# kubectl get svc -n monitoring
NAME                    TYPE        CLUSTER-IP      EXTERNAL-IP   PORT(S)                      AGE
alertmanager-main       ClusterIP   10.99.189.210   <none>        9093/TCP                     8d
alertmanager-operated   ClusterIP   None            <none>        9093/TCP,9094/TCP,9094/UDP   8d
blackbox                ClusterIP   10.108.47.141   <none>        9115/TCP                     18h
grafana                 ClusterIP   10.104.30.183   <none>        3000/TCP                     8d
kafka-exporter          ClusterIP   10.98.228.115   <none>        9308/TCP                     20h
kube-state-metrics      ClusterIP   None            <none>        8443/TCP,9443/TCP            8d
node-exporter           ClusterIP   None            <none>        9100/TCP                     8d
prometheus-adapter      ClusterIP   10.108.67.0     <none>        443/TCP                      8d
prometheus-k8s          ClusterIP   10.96.50.138    <none>        9090/TCP                     8d
prometheus-operated     ClusterIP   None            <none>        9090/TCP                     16h
prometheus-operator     ClusterIP   None            <none>        8443/TCP                     8d
定义ingress,用于访问alertmanager、grafana、prometheus
prom-monitor.yaml
apiVersion: extensions/v1beta1
kind: Ingress
metadata:
  name: prom-monitor
  namespace: monitoring
spec:
  rules:
  - host: alert.test.com
    http:
      paths:
      - backend:
          serviceName: alertmanager-main
          servicePort: 9093
        path: /
  - host: grafana.test.com
    http:
      paths:
      - backend:
          serviceName: grafana
          servicePort: 3000
        path: /
  - host: prom.test.com
    http:
      paths:
      - backend:
          serviceName: prometheus-k8s
          servicePort: 9090
        path: /
grafana.test.com prom.test.com alert.test.com
修改本机hosts文件
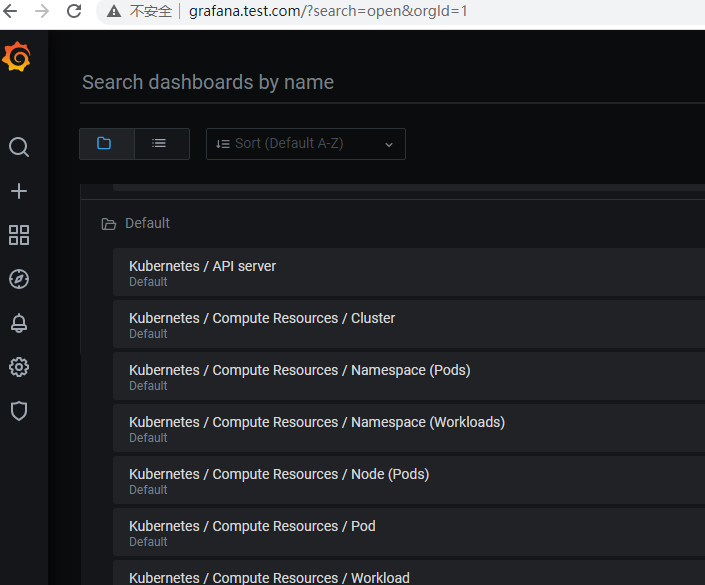
访问 grafana.test.com,其本身提供了很多dashboard
原文:https://www.cnblogs.com/bigberg/p/14009940.html