beats通常用来收集某些重要系统组件,比如nginx,redis等产生的日志信息,然后发送给logstash处理后,再发送给es,再通过kibana去进行一个报表的显示,来使得日志信息更加便于查看,更有利于排查问题
以下是一个nginx日志收集的示例图
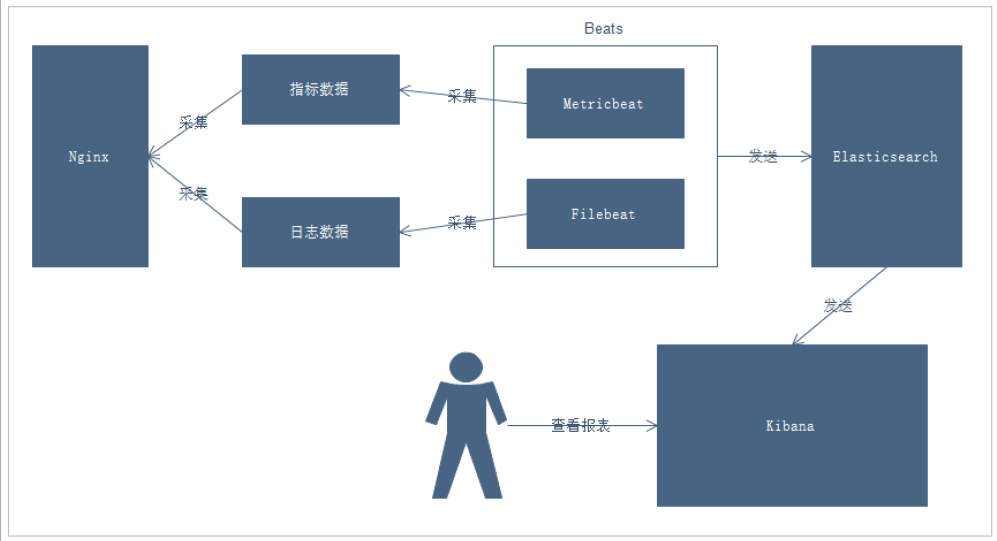
说明:
通过Beats采集Nginx的指标数据和日志数据
Beats采集到数据后发送到Elasticsearch中
Kibana读取数据进行分析
用户通过Kibana进行查看分析报表
通过查看ElasticStack可以发现,Beats主要用于采集数据
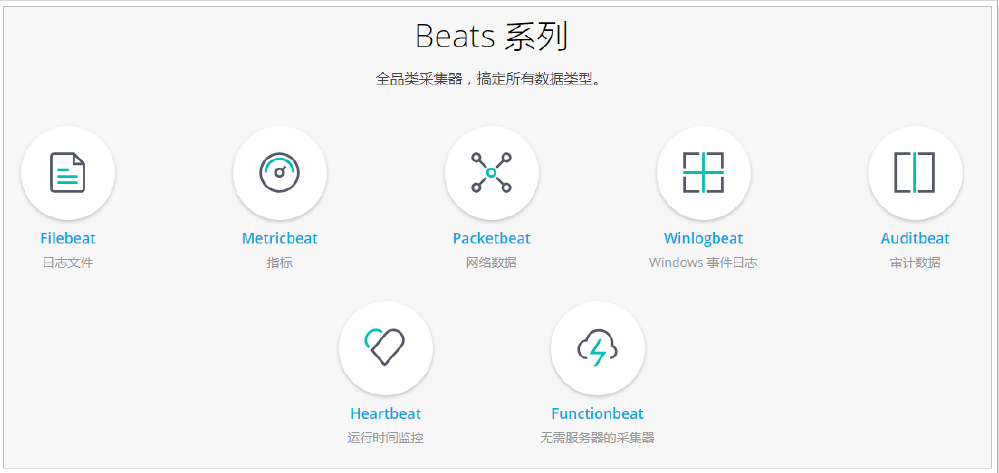
官网地址:https://www.elastic.co/cn/beats/
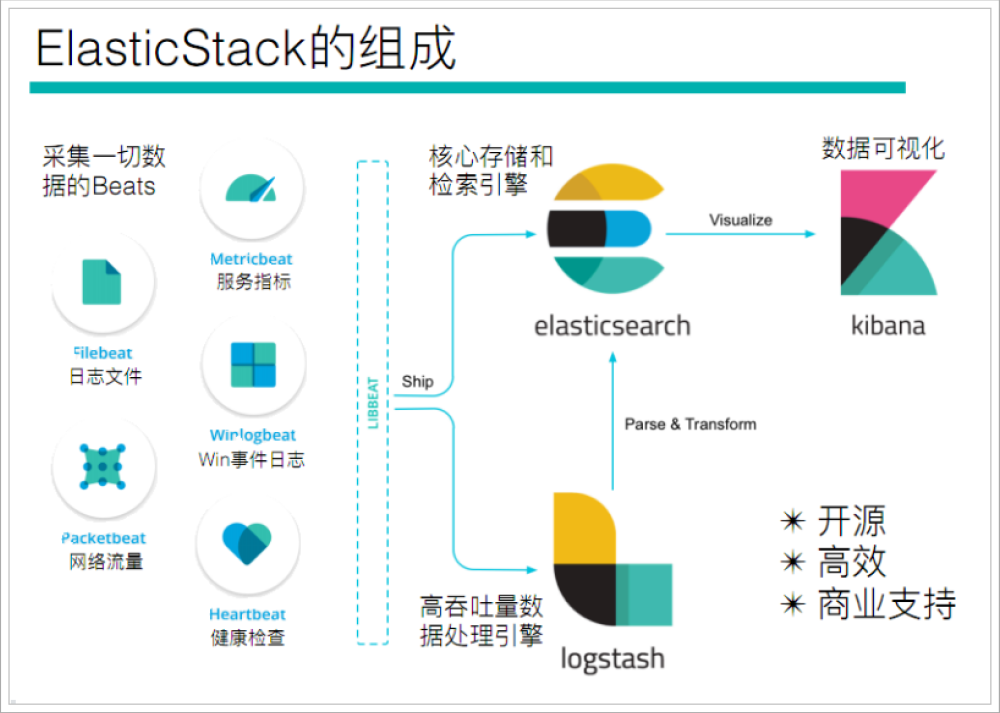
Beats平台其实是一个轻量性数据采集器,通过集合多种单一用途的采集器,从成百上千台机器中向Logstash或ElasticSearch中发送数据。

通过Beats包含以下的数据采集功能
如果我们的数据不需要任何处理,那么就可以直接发送到ElasticSearch中
如果们的数据需要经过一些处理的话,那么就可以发送到Logstash中,然后处理完成后,在发送到ElasticSearch
最后在通过Kibana对我们的数据进行一系列的可视化展示
Filebeat是一个轻量级的日志采集器
当你面对成百上千、甚至成千上万的服务器、虚拟机和溶气气生成的日志时,请告别SSH吧!Filebeat将为你提供一种轻量型方法,用于转发和汇总日志与文件,让简单的事情不再繁华,关于Filebeat的记住以下两点:
Filebeat主要由下面几个组件组成: harvester、prospector 、input
用于监控、收集服务器日志文件.
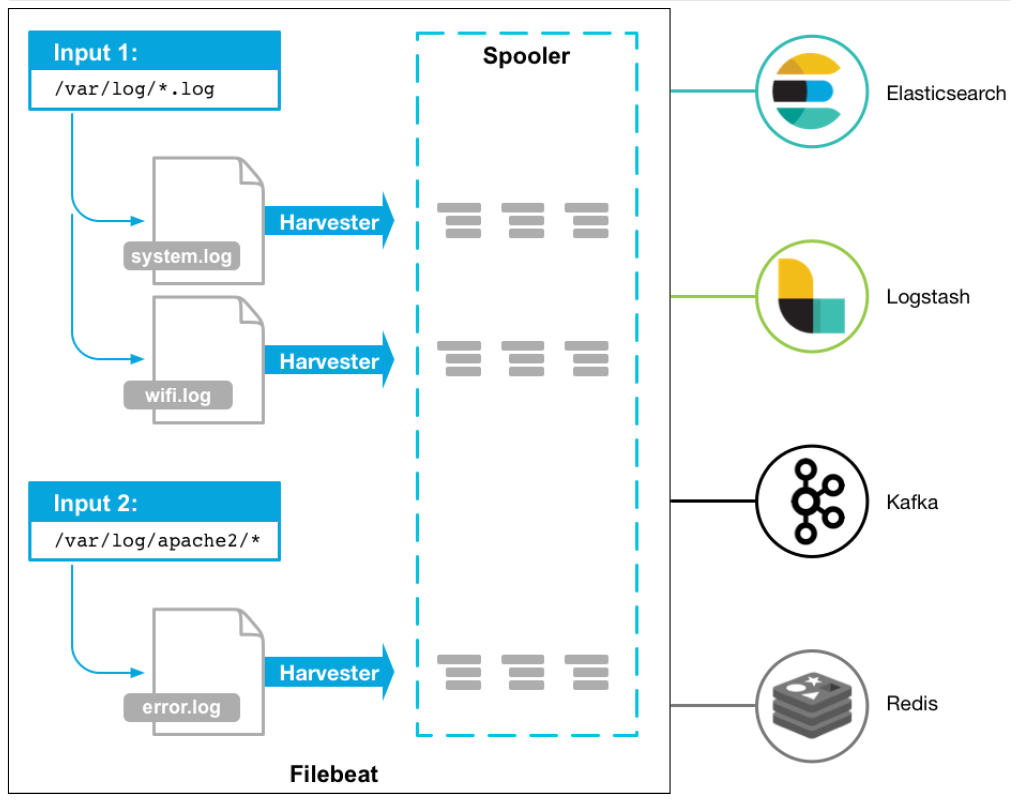
流程如下:
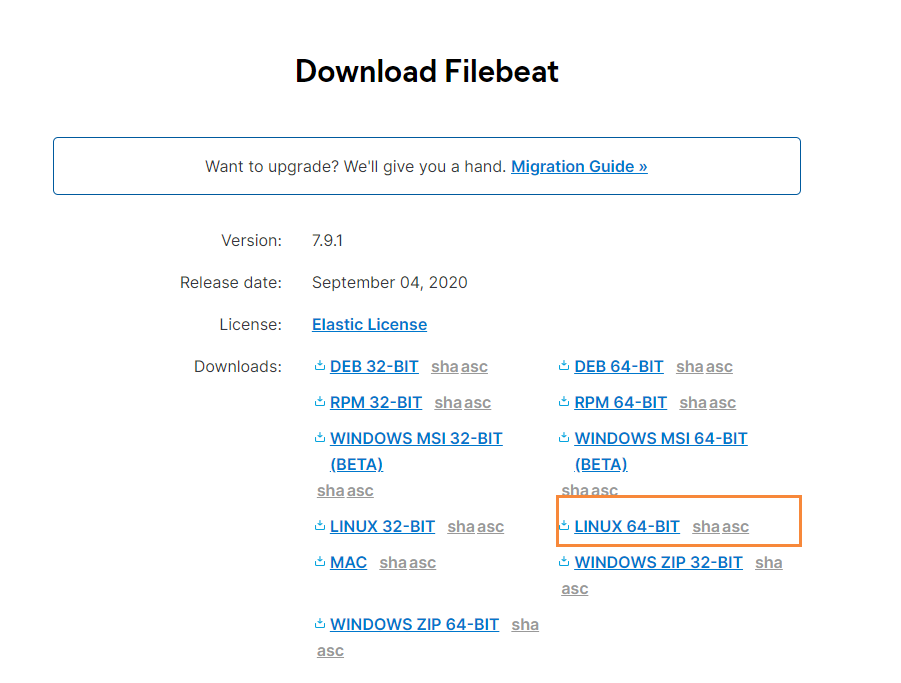
官网地址:https://www.elastic.co/cn/downloads/beats/filebeat
选中对应版本的Filebeat,我这里是Centos部署的,所以下载Linux版本
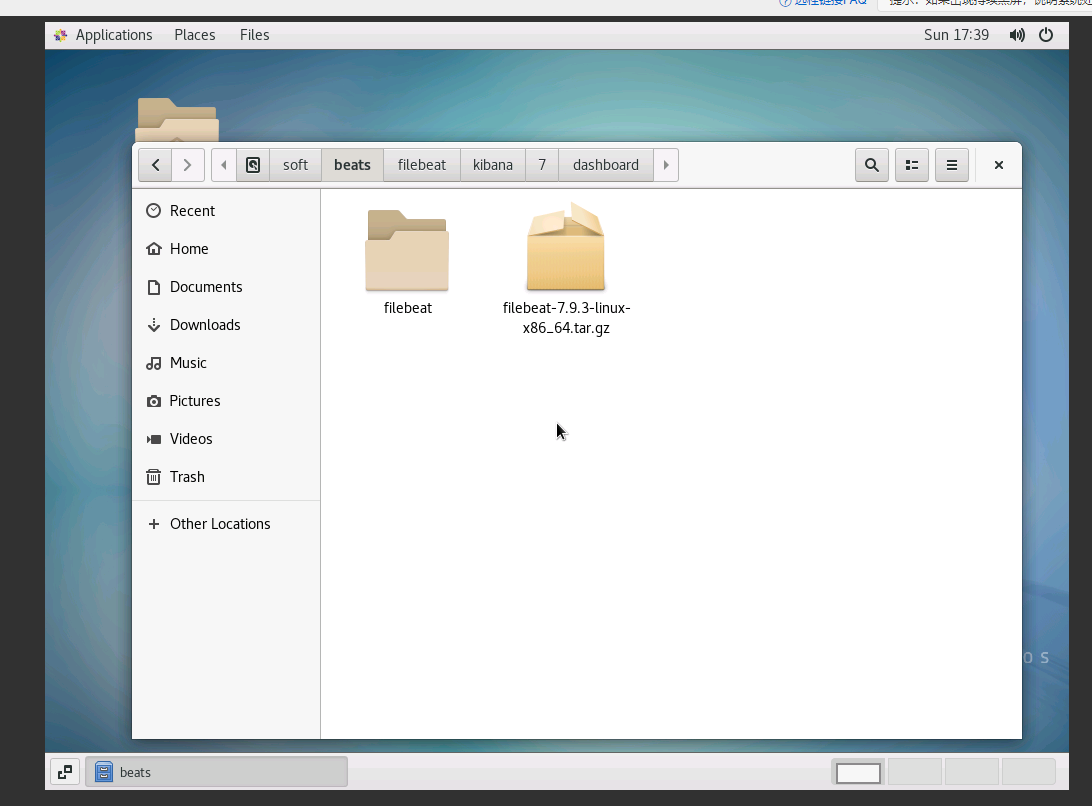
在windows上下载好filebeat的压缩包,然后创建一个相应的文件夹,在其下解压压缩包,然后为了方便,将文件夹重命名,比如我下载的是filebeat-7.9.3-linux-x86_64.tar.gz,那么相关命令就是
# 创建文件夹
mkdir -p /soft/beats
# 解压文件
tar -zxvf filebeat-7.9.3-linux-x86_64.tar.gz
# 重命名
mv filebeat-7.9.3-linux-x86_64/ filebeat
进入filebeat文件夹下,编写一个简单的配置文件test.yml
启动的相应配置文件为test.yml
filebeat.inputs: # filebeat input输入
- type: stdin    # 标准输入
  enabled: true  # 启用标准输入
setup.template.settings:
  index.number_of_shards: 3 # 指定下载数
output.console:  # 控制台输出
  pretty: true   # 启用美化功能
  enable: true
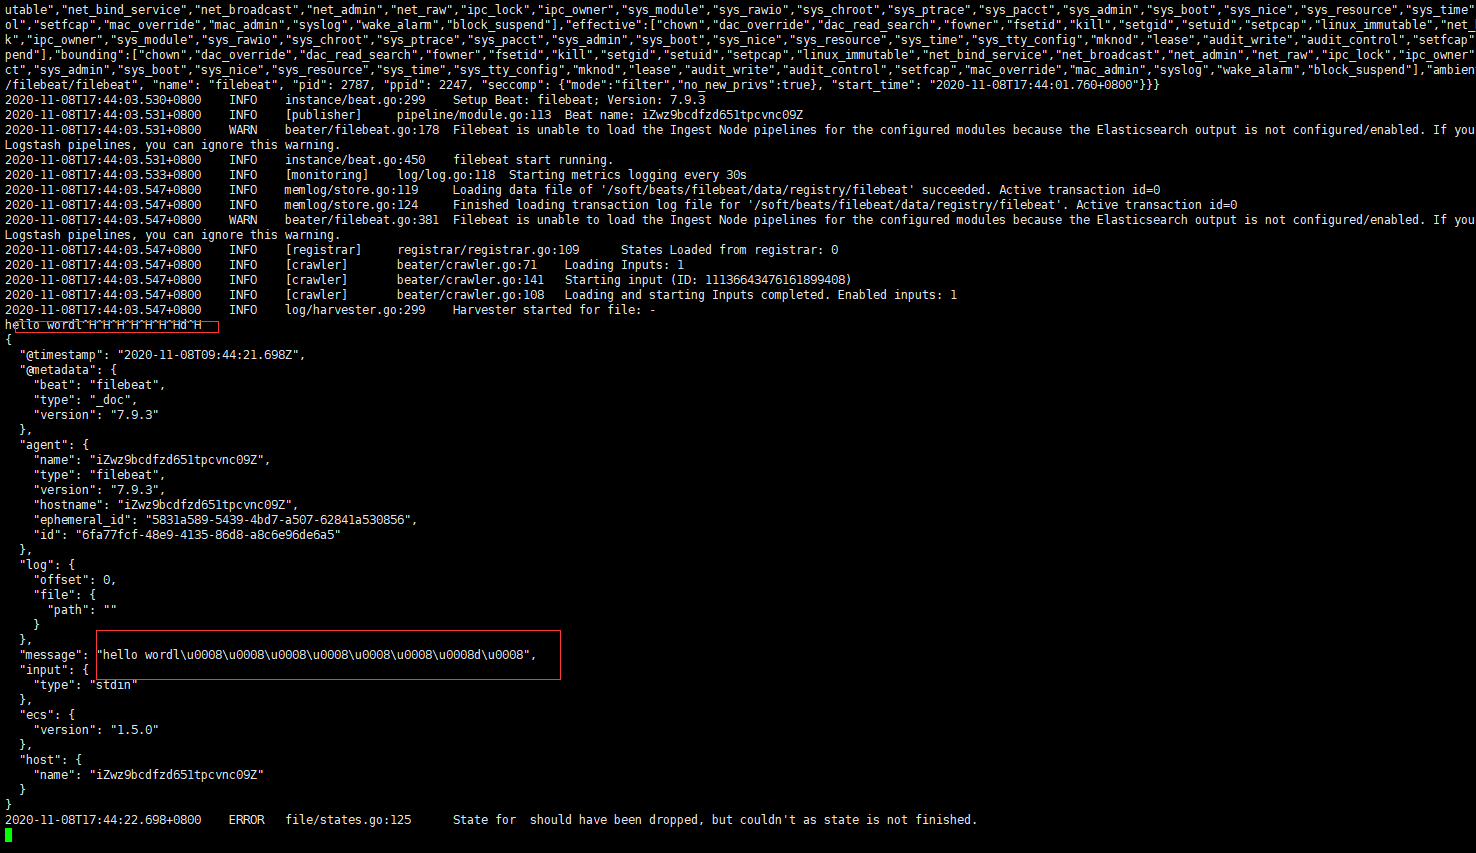
在控制台输入,则会相应的在控制台输出
启动指令如下
./filebeat -e -c test.yml
test-log.yml配置文件如下
#test-log.yml
filebeat.inputs:
- type: log
  enabled: true
  paths:
    - /soft/beats/logs/*.log
setup.template.settings:
  index.number_of_shards: 3
output.console:
  pretty: true
  enable: true
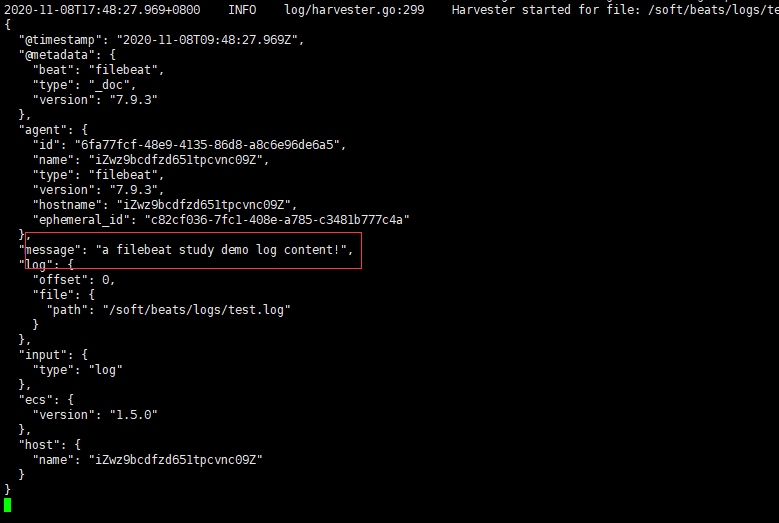
启动指令
./filebeat -e -c test-log.yml
path部分windows中和linux中有些不同 windows中是‘\‘ 而linux中是‘/‘
并且linux中会自动捕捉所扫描到的log文件中的补充内容并且显示,而windows中则需要按下空格,并且会少扫描到一行
#test-tag.log内容如下
filebeat.inputs:
- type: log
enabled: true
paths:
- /soft/beats/logs/*.log
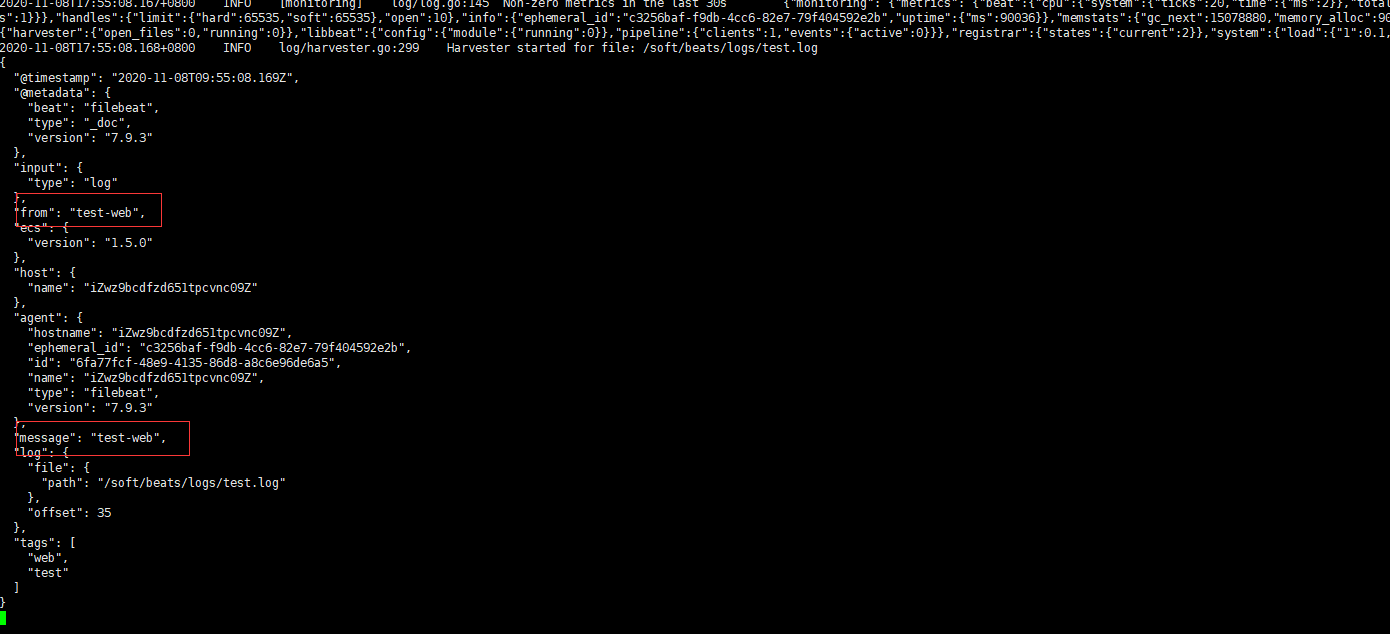
tags: ["web", "test"] #添加自定义tag,便于后续的处理
fields: #添加自定义字段
from: test-web
fields_under_root: true #true为添加到根节点,false为添加到子节点中
setup.template.settings:
index.number_of_shards: 3
output.console:
pretty: true
enable: true
重启一下filebeat
相关命令为
#启动命令为
./filebeat -e -c test-tag.yml

#给test.log文件里追加相应数据
echo "test-web" >> test.log
输出到es上,配置文件如下
filebeat.inputs:
- type: log
enabled: true
paths:
- /soft/beats/logs/*.log
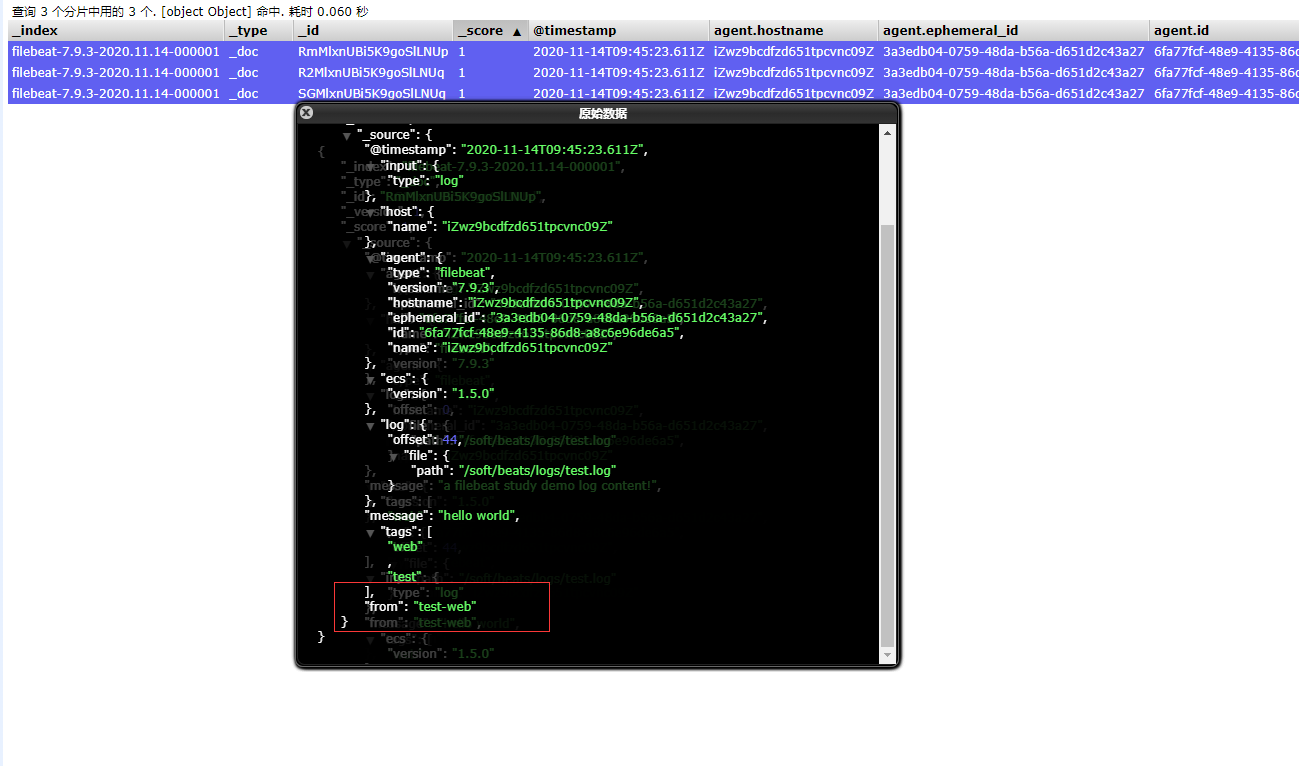
tags: ["web", "test"] #添加自定义tag,便于后续的处理
fields: #添加自定义字段
from: test-web
fields_under_root: true #true为添加到根节点,false为添加到子节点中
setup.template.settings:
index.number_of_shards: 3
output.elasticsearch:
hosts: ["127.0.0.1:9200"]
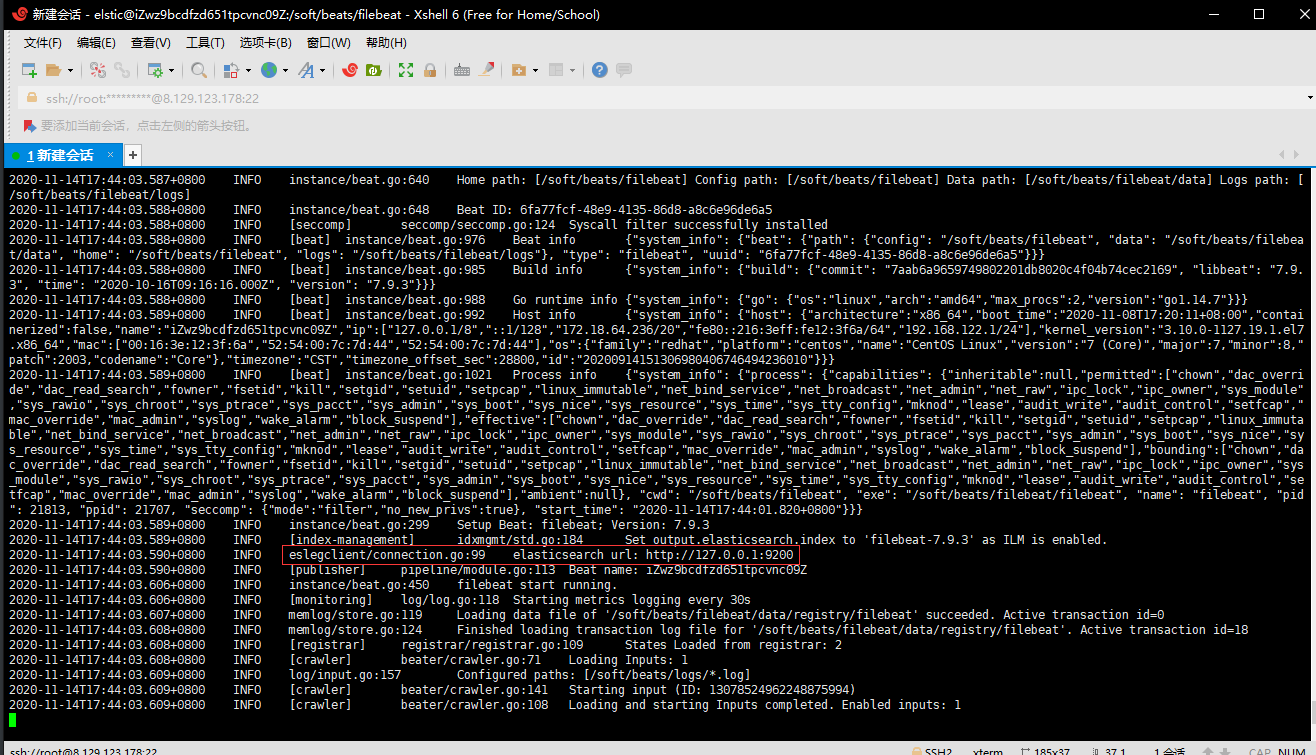
启动后可以看到下面连接到了es上(先启动好elsticsearch)
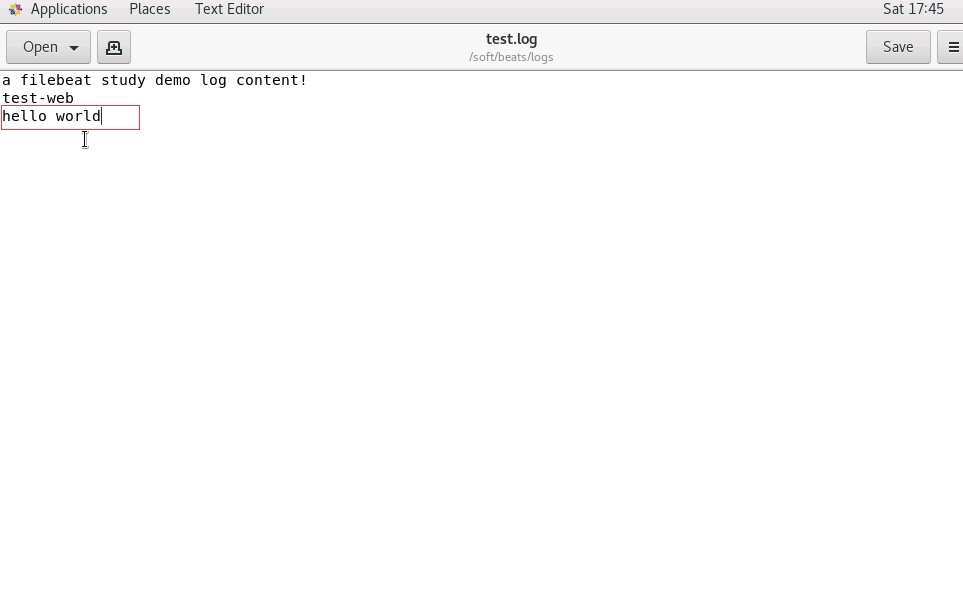
给log文件中添加内容
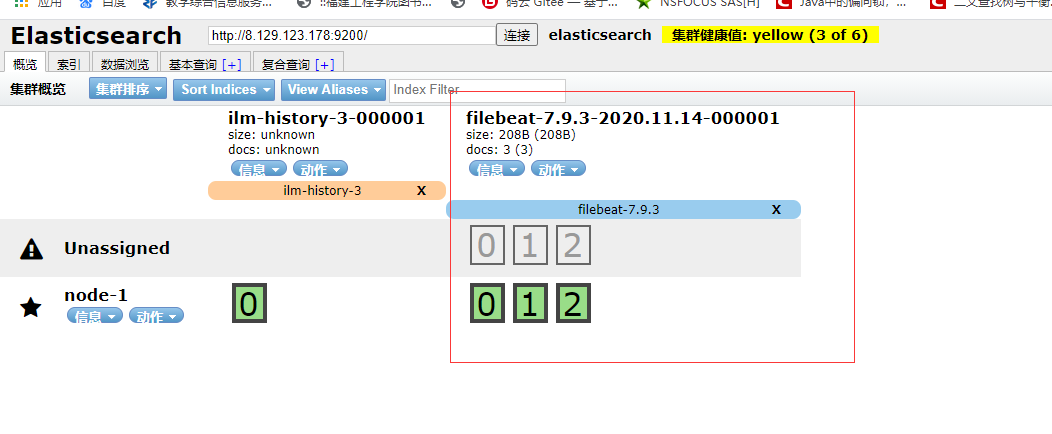
在es中我们可以看到多了一个索引库
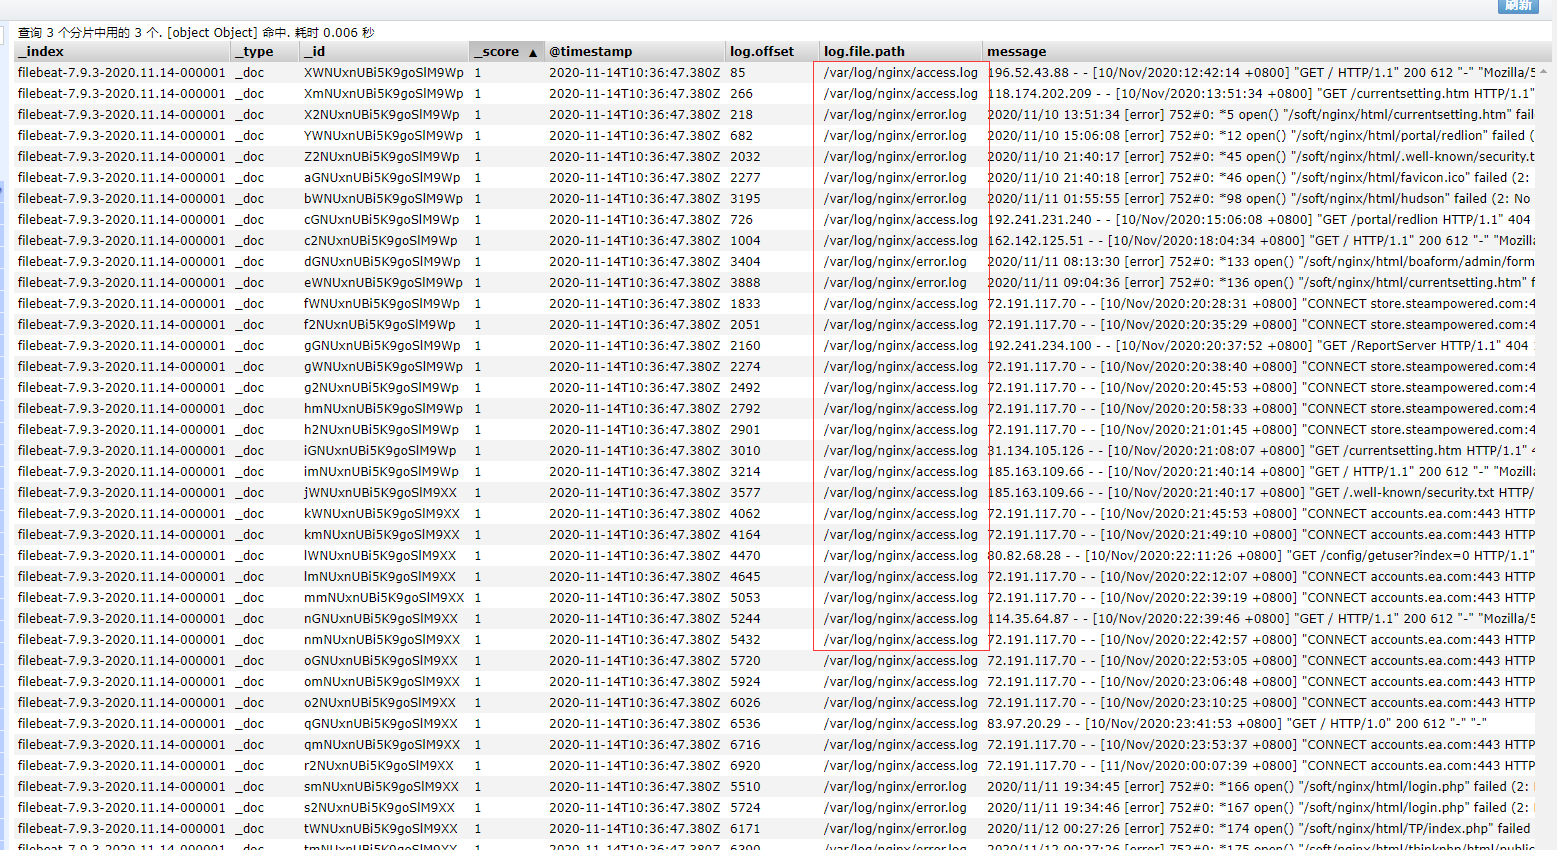
此时,我们来读取一下nginx里的日志文件
创建新的配置文件test-nginx.yml
filebeat.inputs:
- type: log
  enabled: true
  paths:
    - /var/log/nginx/*.log
  tags: ["nginx"]
  fields_under_root: false
setup.template.settings:
  index.number_of_shards: 1
output.elasticsearch:
  hosts: ["127.0.0.1:9200"]
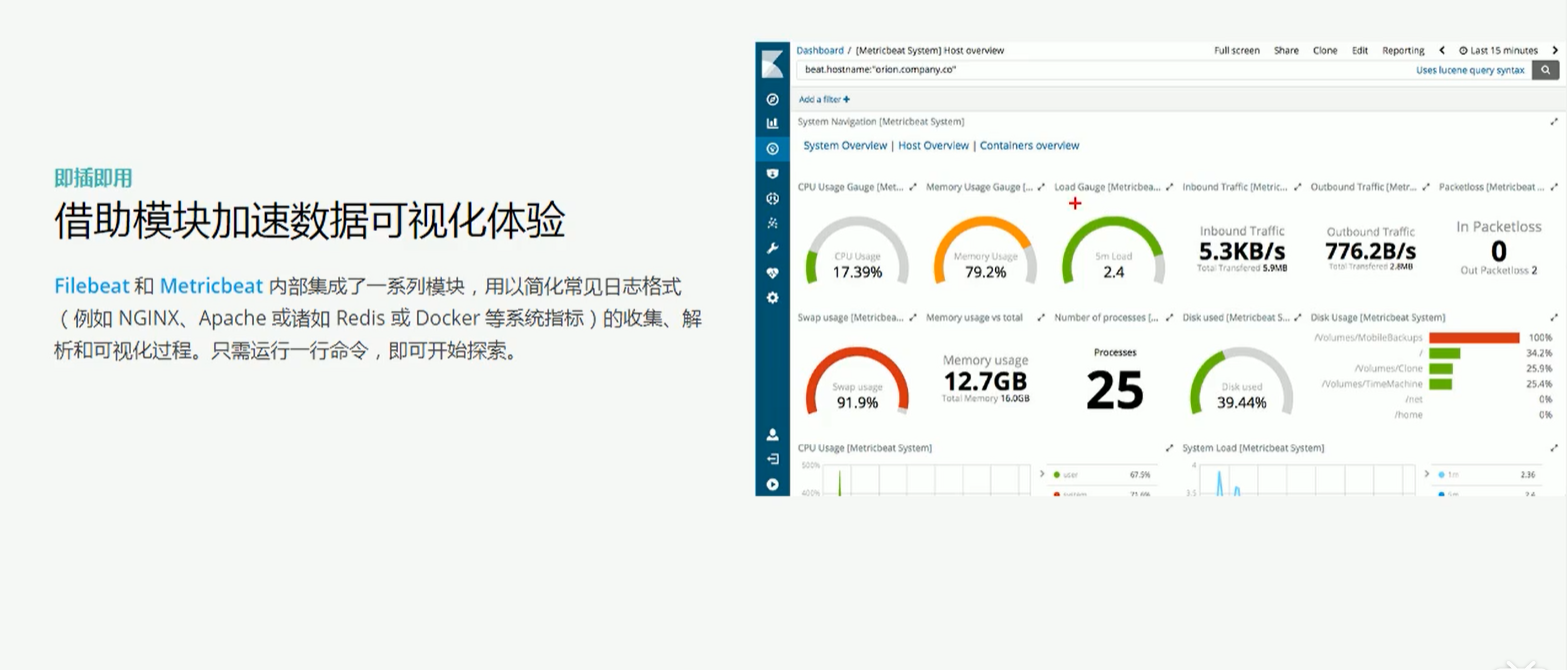
前面要想实现日志数据的读取以及处理都是自己手动配置的,其实,在Filebeat中,有大量的Module,可以简化我们的配置,直接就可以使用,如下:
./filebeat modules list
得到的列表如下所示
Disabled:
activemq
apache
auditd
aws
azure
barracuda
bluecoat
cef
checkpoint
cisco
coredns
crowdstrike
cylance
elasticsearch
envoyproxy
f5
fortinet
googlecloud
gsuite
haproxy
ibmmq
icinga
iis
imperva
infoblox
iptables
juniper
kafka
kibana
logstash
microsoft
misp
mongodb
mssql
mysql
nats
netflow
netscout
nginx
o365
okta
osquery
panw
postgresql
rabbitmq
radware
redis
santa
sonicwall
sophos
squid
suricata
system
tomcat
traefik
zeek
zscaler
可以看到,内置了很多的module,但是都没有启用,如果需要启用需要进行enable操作:
#启动
./filebeat modules enable nginx
#禁用
./filebeat modules disable nginx
可以发现,nginx的module已经被启用。
我们到下面的目录,就能看到module的配置了
# 进入到module目录
cd modules.d/
#查看文件
vim nginx.yml.disabled
得到的文件内容如下所示
# Module: nginx
# Docs: https://www.elastic.co/guide/en/beats/filebeat/7.9/filebeat-module-nginx.html

- module: nginx
  # Access logs
  access:
    enabled: true
    # 添加日志文件
    var.paths: ["/var/log/nginx/access.log*"]

    # Set custom paths for the log files. If left empty,
    # Filebeat will choose the paths depending on your OS.
    #var.paths:

  # Error logs
  error:
    enabled: true
    var.paths: ["/var/log/nginx/error.log*"]
我们需要修改刚刚的test-nginx.yml文件,然后添加到我们的module
filebeat.inputs:
- type: log
  enabled: true
  paths:
    - /var/log/nginx/*.log
setup.template.settings:
  index.number_of_shards: 1
output.elasticsearch:
  hosts: ["127.0.0.1:9200"]
filebeat.config.modules:
  path: ${path.config}/modules.d/*.yml
  reload.enabled: false
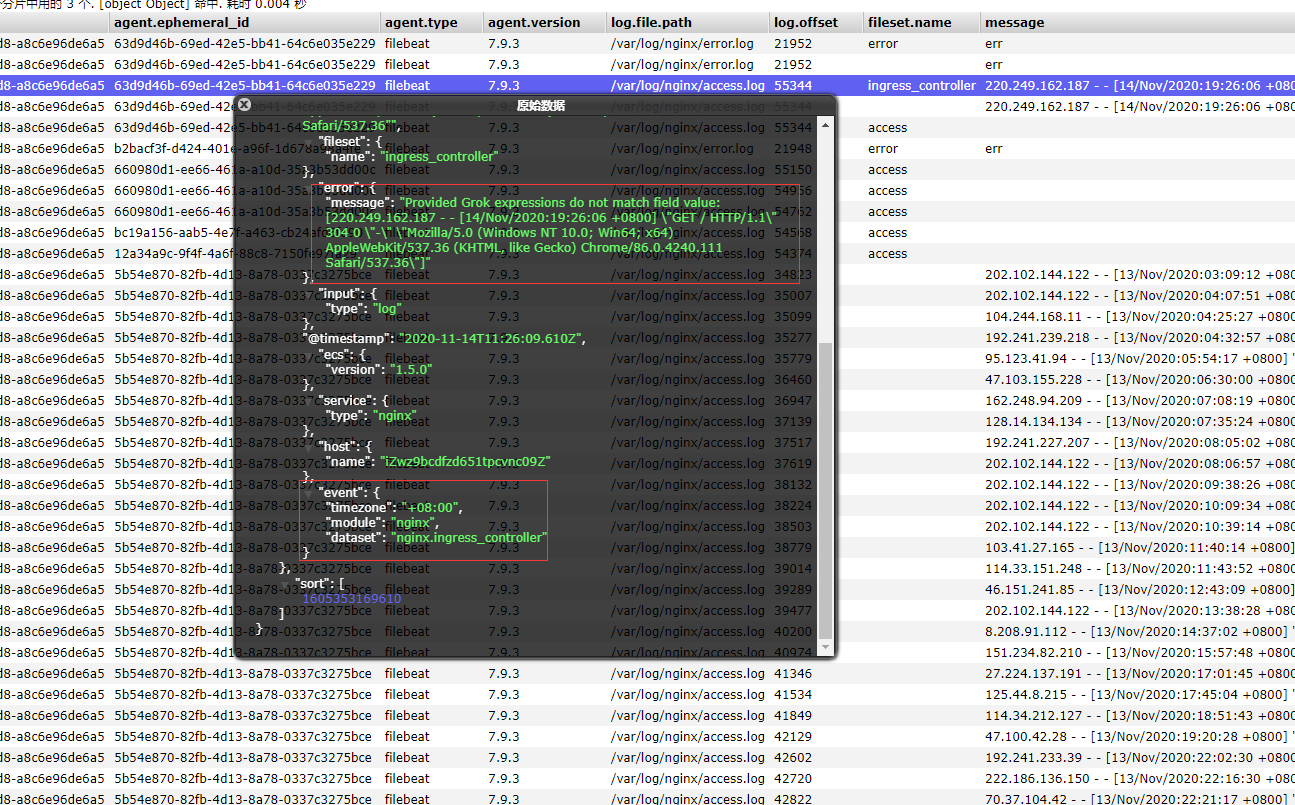
刷新一下nginx的访问页面,则如下图所示,模板已经起了作用

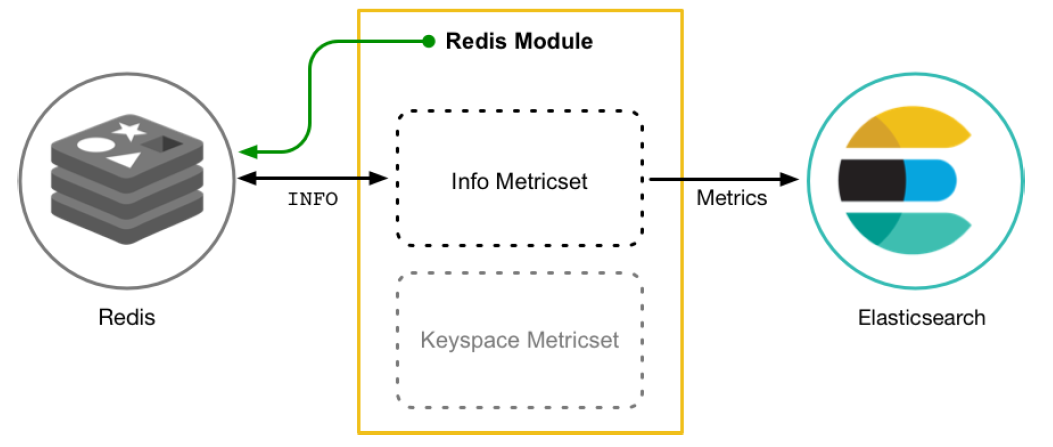
Metricbeat有2部分组成,一部分是Module,另一个部分为Metricset
以Redis Module为例:
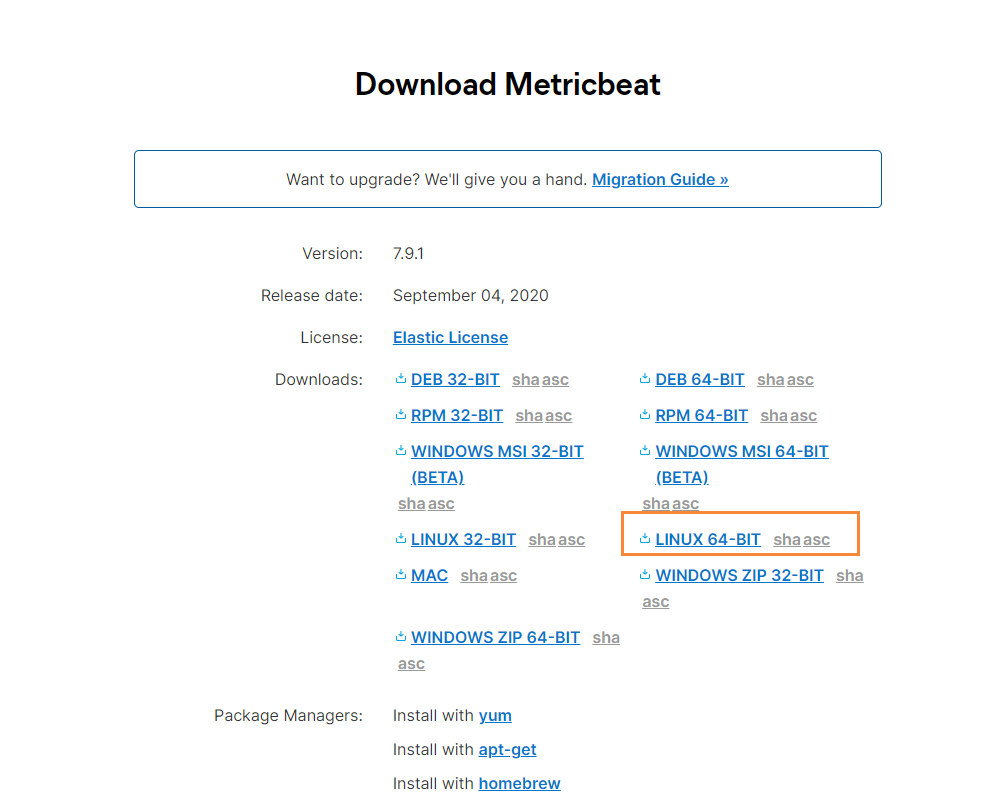
首先我们到官网,找到Metricbeat进行下载
下载完成后,我们通过xftp工具,移动到指定的目录下
# 移动到该目录下
cd /soft/beats
# 解压文件
tar -zxvf
# 修改文件名
mv  metricbeat
然后修改配置文件
vim metricbeat.yml
添加如下内容
metricbeat.config.modules:
  path: ${path.config}/modules.d/*.yml
  reload.enabled: false
setup.template.settings:
  index.number_of_shards: 1
  index.codec: best_compression
setup.kibana:
output.elasticsearch:
  hosts: [""127.0.0.1:9200"]
processors:
  - add_host_metadata: ~
  - add_cloud_metadata: ~
默认会指定的配置文件,就是在
${path.config}/modules.d/*.yml
也就是 system.yml文件,我们也可以自行开启其它的收集
在配置完成后,我们通过如下命令启动即可
./metricbeat -e
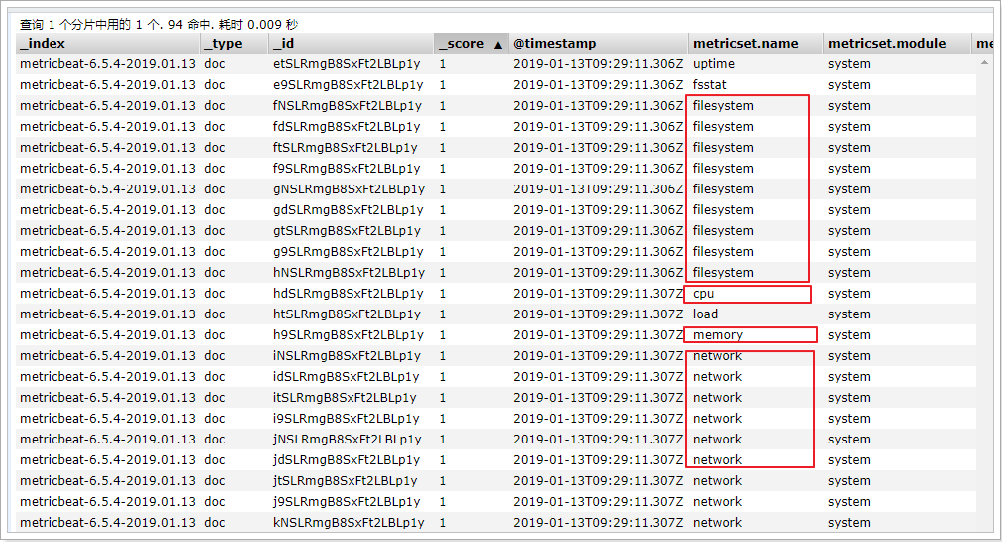
在ELasticsearch中可以看到,系统的一些指标数据已经写入进去了:
- module: system
  period: 10s  # 采集的频率,每10秒采集一次
  metricsets:  # 采集的内容
    - cpu
    - load
    - memory
    - network
    - process
    - process_summary
Metricbeat Module的用法和我们之前学的filebeat的用法差不多
#查看列表
./metricbeat modules list
能够看到对应的列表
Enabled:
system #默认启用

Disabled:
aerospike
apache
ceph
couchbase
docker
dropwizard
elasticsearch
envoyproxy
etcd
golang
graphite
haproxy
http
jolokia
kafka
kibana
kubernetes
kvm
logstash
memcached
mongodb
munin
mysql
nginx
php_fpm
postgresql
prometheus
rabbitmq
redis
traefik
uwsgi
vsphere
windows
在nginx中,需要开启状态查询,才能查询到指标数据。
#重新编译nginx
./configure --prefix=/usr/local/nginx --with-http_stub_status_module
make
make install

./nginx -V #查询版本信息
nginx version: nginx/1.11.6
built by gcc 4.4.7 20120313 (Red Hat 4.4.7-23) (GCC)
configure arguments: --prefix=/usr/local/nginx --with-http_stub_status_module

#配置nginx
vim nginx.conf
location /nginx-status {
    stub_status on;
    access_log off;
}

# 重启nginx
./nginx -s reload
测试
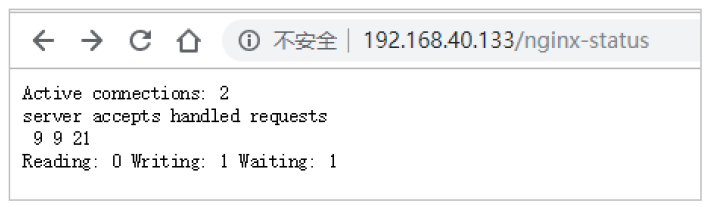
结果说明:
#启用redis module
./metricbeat modules enable nginx

#修改redis module配置
vim modules.d/nginx.yml
然后修改下面的信息
# Module: nginx
# Docs: https://www.elastic.co/guide/en/beats/metricbeat/6.5/metricbeat-modulenginx.
html
  - module: nginx
#metricsets:
# - stubstatus
  period: 10s
# Nginx hosts
  hosts: ["http://127.0.0.1"]
# Path to server status. Default server-status
  server_status_path: "nginx-status"
#username: "user"
#password: "secret"
修改完成后,启动nginx
#启动
./metricbeat -e
我们能看到,我们的nginx数据已经成功的采集到我们的系统中了
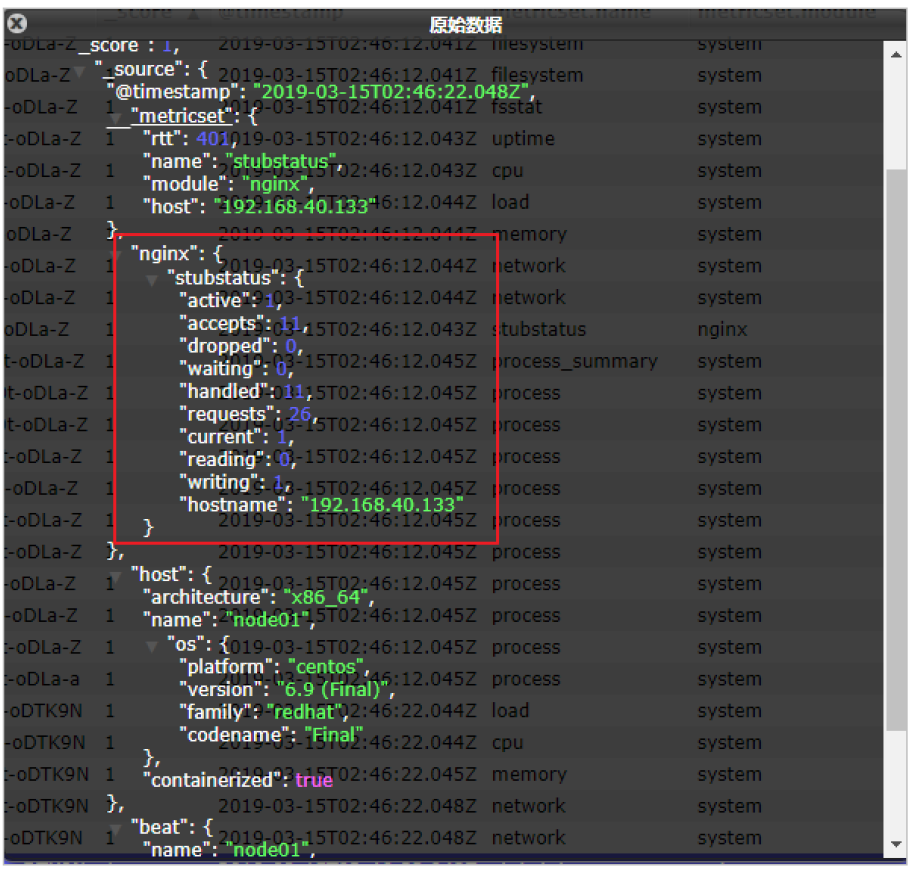
可以看到,nginx的指标数据已经写入到了Elasticsearch。
原文:https://www.cnblogs.com/kabuda/p/13974464.html