能够部署kibana并连接elasticsearch集群
能够通过kibana查看elasticsearch索引信息
知道用?lebeat收集日志相对于logstash的优点
能够安装?lebeat
kibana介绍
Kibana是一个开源的可视化平台,可以为ElasticSearch集群的管理提供友好的Web界面,帮助汇总,分析和搜索重要的日
志数据。文档路径: <https://www.elastic.co/guide/en/kibana/current/setup.html>;
kibana部署
第1步: 在kibana服务器(我这里是VM1)上安装kibana
[root\@vm1 \~]# wget
https://artifacts.elastic.co/downloads/kibana/kibana-6.5.2- x86_64.rpm
第2步: 配置kibana
日志要自己建立,并修改owner和group属性
[root\@vm1 \~]# touch /var/log/kibana.log
[root\@vm1 \~]# chown kibana.kibana /var/log/kibana.log
端口
监听所有,允许所有人能访问
ES集群的路径
我这里加了kibana日志,方便排错与调试
server.port: 5601
server.host: "0.0.0.0"
elasticsearch.url: "http://10.1.1.12:9200" logging.dest: /var/log/kibana.log
[root\@vm1 \~]# cat /etc/kibana/kibana.yml |grep -v ‘#‘ |grep -v ‘\^\$‘
第3步: 启动kibana服务
0t0 TCP *:esmagent (LISTEN)
11u IPv4 111974
10420 kibana
node
FD TYPE DEVICE SIZE/OFF NODE NAME
USER
COMMAND PID
[root\@vm1 \~]# lsof -i:5601
[root\@vm1 \~]# systemctl start kibana
[root\@vm1 \~]# systemctl enable kibana
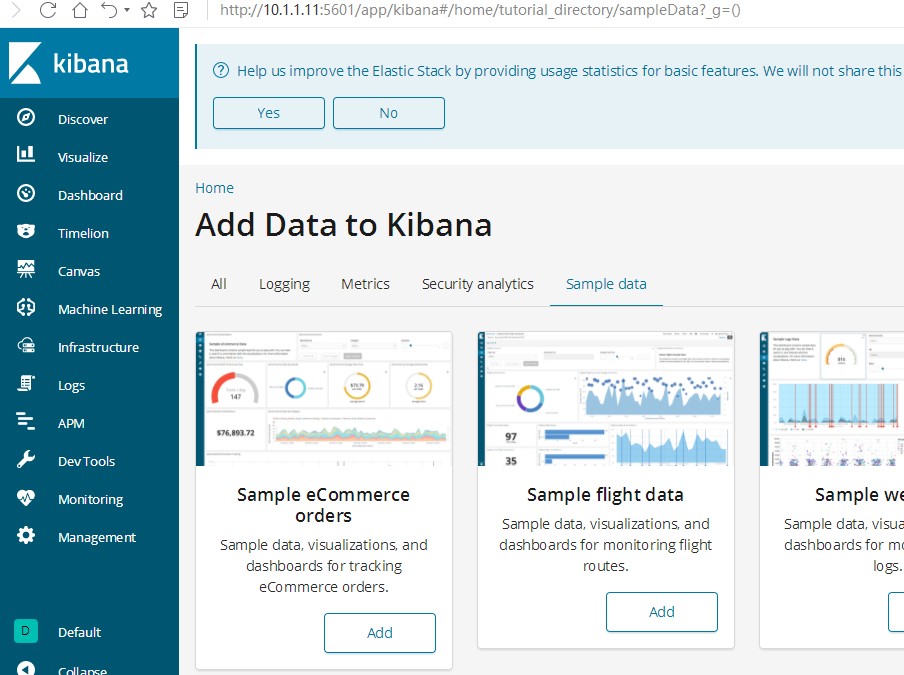
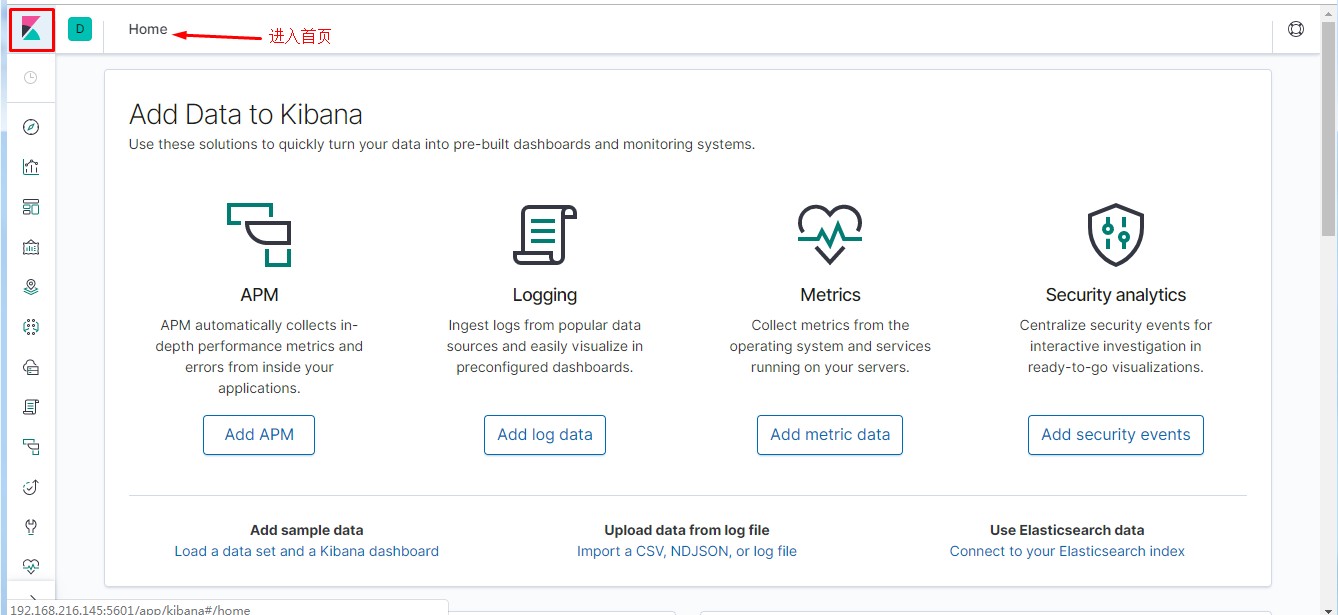
第4步: 通过浏览器访问 http://kibana服务器IP:5601
kibana汉化
ELK版本为7.1.1
kibana不需要单独汉化,在kibana配置文件中最后一行修改为"zh-CN"即可。以下汉化仅为7.0以前版本。
<https://github.com/anbai-inc/Kibana_Hanization/>;
[root\@vm1 \~]# unzip Kibana_Hanization-master.zip -d /usr/local [root\@vm1
\~]# cd /usr/local/Kibana_Hanization-master/
这里要注意:1,要安装python; 2,rpm版的kibana安装目录为/usr/share/kibana/
[root\@vm1 Kibana_Hanization-master]# python main.py /usr/share/kibana/
汉化完后需要重启
[root\@vm1 Kibana_Hanization-master]# systemctl stop kibana
[root\@vm1 Kibana_Hanization-master]# systemctl start kibana
[root\@vm1 \~]# wget
https://github.com/anbai-inc/Kibana_Hanization/archive/master.zip

再次通过浏览器访问 http://kibana服务器IP:5601
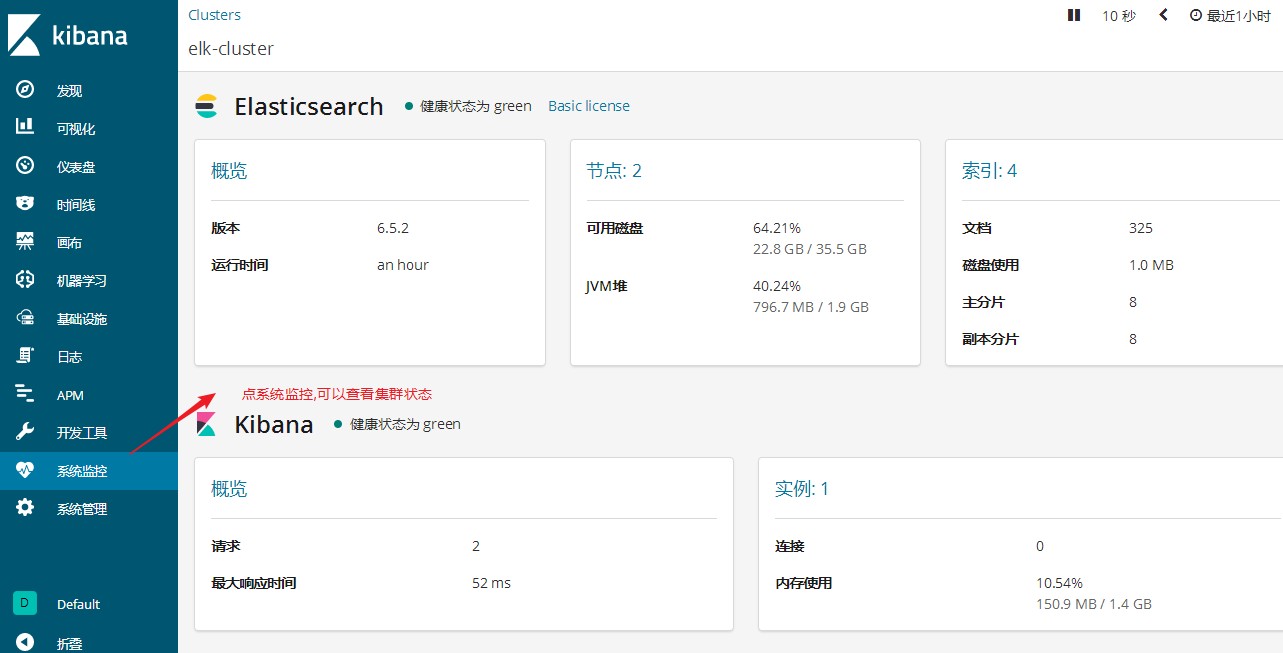
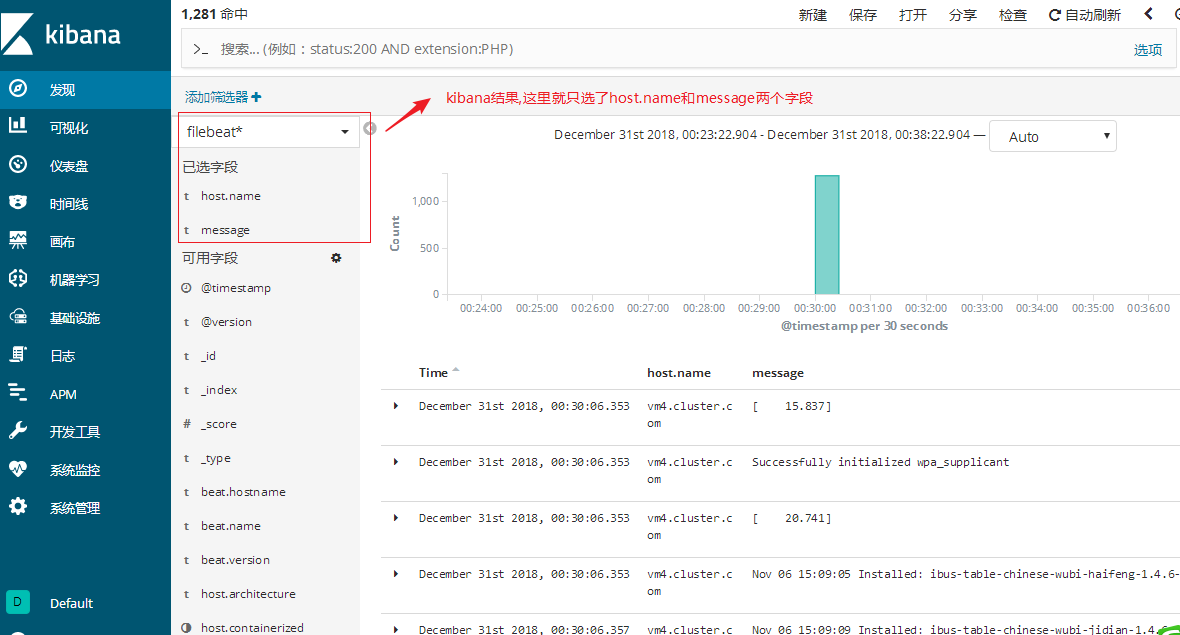
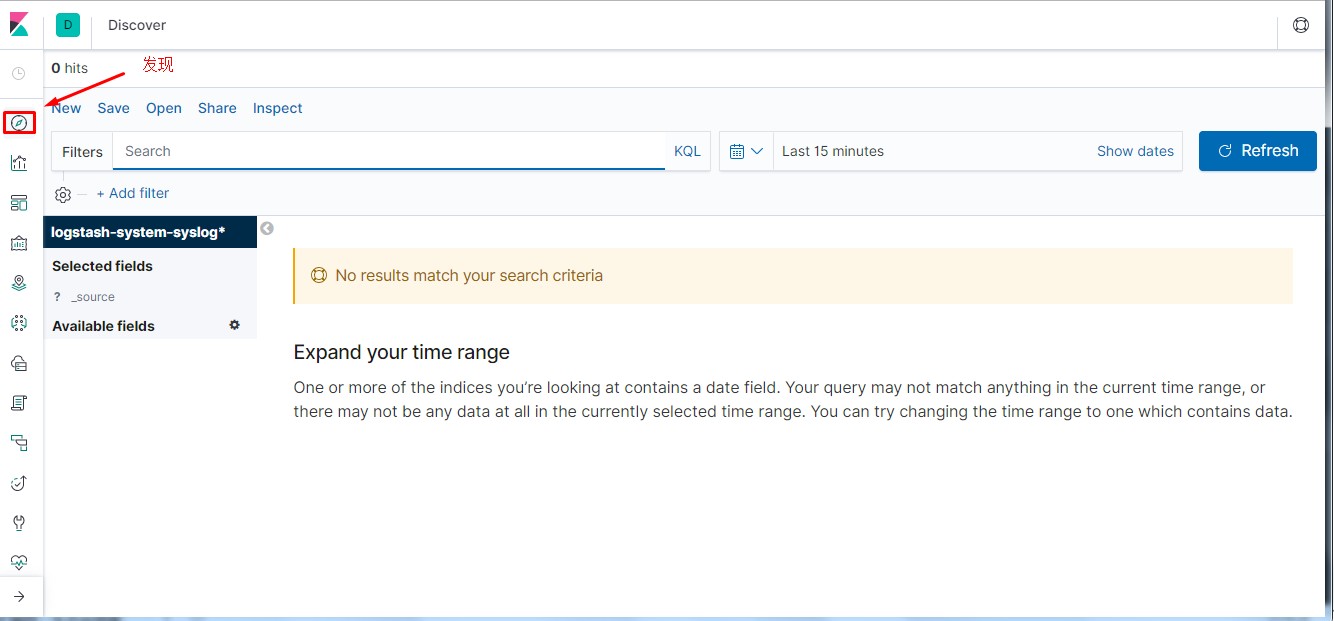
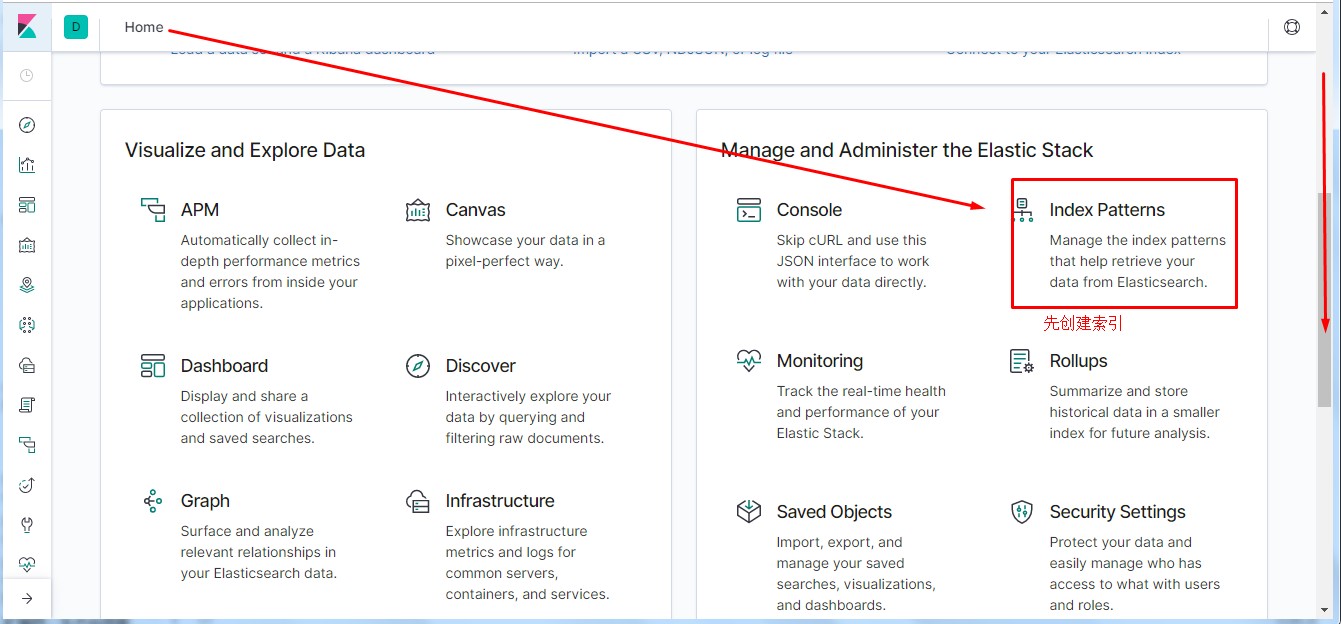
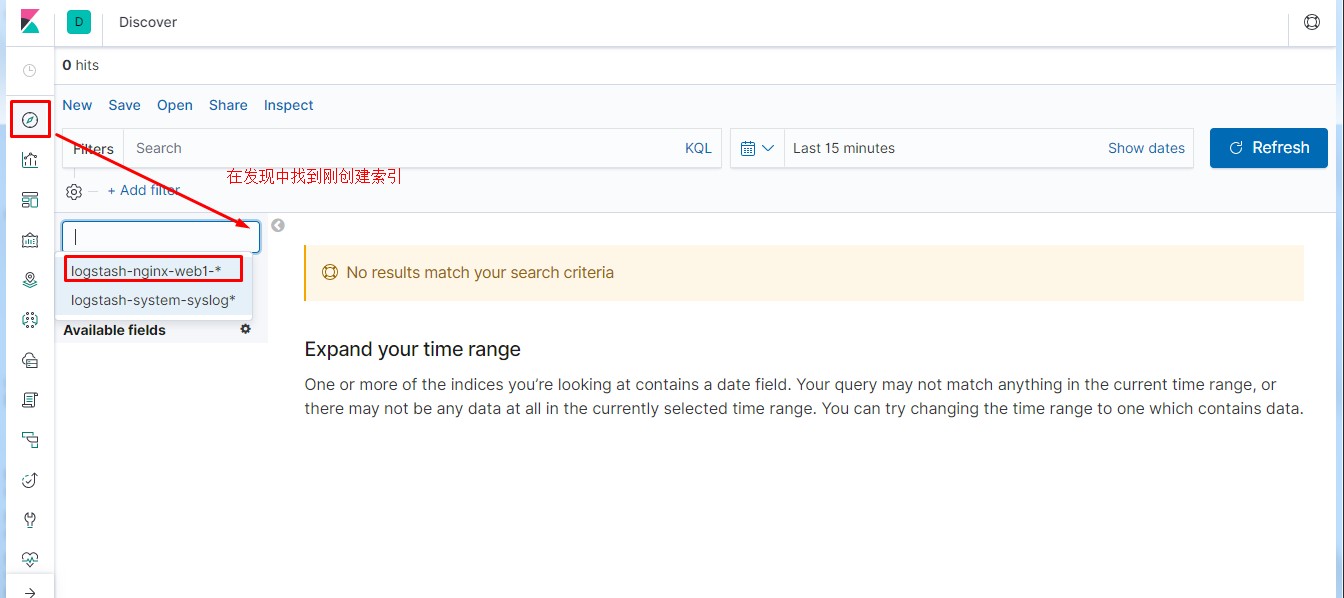
通过kibana查看logstash收集的日志索引

最后点发现查看

因为logstash太费内存了,如果在要采集的服务上都安装logstash,你可以想象这样这样资源消耗多高。所以我们要用
轻量级的采集工具才更高效,更省资源。
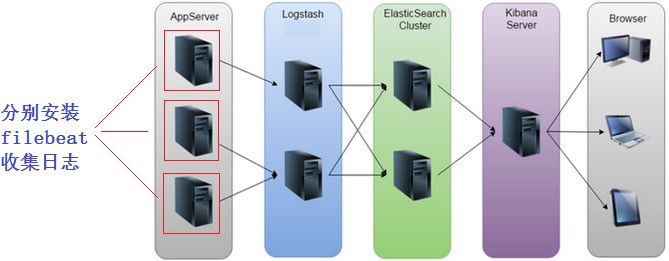
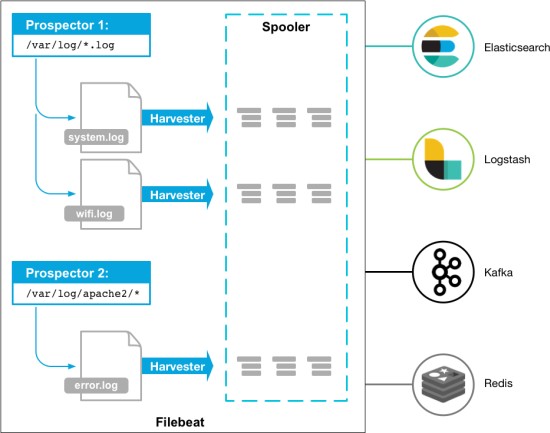
beats是轻量级的日志收集处理工具,Beats占用资源少
Packetbeat: 网络数据(收集网络流量数据)
Metricbeat: 指标 (收集系统、进程和文件系统级别的 CPU
和内存使用情况等数据)Filebeat: 文件(收集日志文件数据)
Winlogbeat: windows事件日志(收集 Windows 事件日志数据) Auditbeat: 审 计
数 据 ( 收 集 审 计 日 志 ) Heartbeat:运行时间监控
(收集系统运行时的数据)
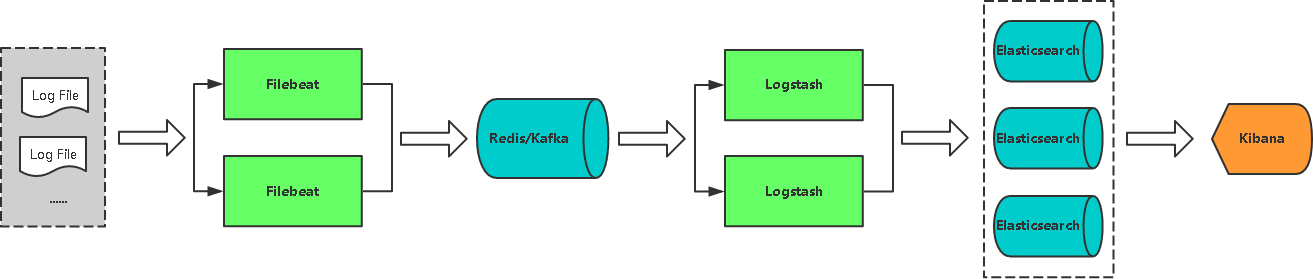
?lebeat实验拓扑
我们这里主要是收集日志信息, 所以只讨论?lebeat。
?lebeat可以直接将采集的日志数据传输给ES集群(EFK),
也可以给logstash(5044端口接收)。
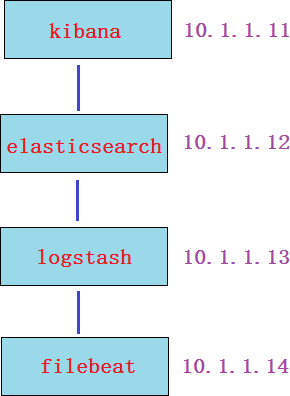
?lebeat收集日志直接传输给ES集群
第1步: 下载并安装?lebeat(再开一台虚拟机vm4模拟?lebeat, 内存1G就够了,
安装?lebeat)
[root\@vm4 \~]# wget
https://artifacts.elastic.co/downloads/beats/filebeat/filebeat- 6.5.2-x86_64.rpm
第2步: 配置?lebeat收集日志
[root\@vm4 \~]\# cat /etc/filebeat/filebeat.yml \|grep -v ‘\#‘ \|grep -v ‘\^\$‘
filebeat.inputs:

\- type: log

>   enabled: true paths:

>   \- /var/log/\*.log

filebeat.config.modules:

改为true

收集的日志路径

>   path: \${path.config}/modules.d/\*.yml reload.enabled: false

>   setup.template.settings: index.number_of_shards: 3

setup.kibana:

>   host: "10.1.1.11:5601"

>   output.elasticsearch: hosts: ["10.1.1.12:9200"]

processors:

改为kibana服务器IP 输出给es集群

es集群节点ip

>   17

18

-   add_host_metadata: \~

-   add_cloud_metadata: \~
第3步: 启动服务
[root\@vm4 \~]# systemctl start filebeat
第4步: 验证
在es-head和kibana上验证(验证过程省略, 参考前面的笔记)
练习:可以尝试使用两台?lebeat收集日志,然后在kibana用筛选器进行筛选过滤查看。(可先把logstash那台关闭
logstash进行安装?lebeat测试)
第1步: 在logstash上要重新配置,开放5044端口给?lebeat连接,并重启logstash服务
output {
elasticsearch {
hosts =\> ["10.1.1.12:9200"]
index =\> "filebeat2-%{+YYYY.MM.dd}"
}
}
[root\@vm3 \~]# cd /usr/share/logstash/bin/ [root\@vm3 bin]# pkill java
[root\@vm3 bin]# ./logstash --path.settings /etc/logstash/ -f
/etc/logstash/conf.d/test.conf &
[root\@vm3 \~]# vim /etc/logstash/conf.d/test.conf input {
beats {
port =\> 5044
}
}
第2步: 建议恢复快照重新安装?lebeat并配置
[root\@vm4 \~]# wget
https://artifacts.elastic.co/downloads/beats/filebeat/filebeat- 6.5.2-x86_64.rpm
第3步: 配置?lebeat收集日志
1 [root\@vm4 \~]# cat /etc/filebeat/filebeat.yml |grep -v ‘#‘ |grep -v
‘\^\$‘
filebeat.inputs:
- type: log enabled: true paths:
- /var/log/*.log
filebeat.config.modules:
改为true
收集的日志路径
path: \${path.config}/modules.d/*.yml reload.enabled: false
setup.template.settings: index.number_of_shards: 3
setup.kibana:
host: "10.1.1.11:5601"
output.logstash:
hosts: ["10.1.1.13:5044"]
processors:
add_host_metadata: \~
改为kibana服务器IP
这两句非常重要,表示日志输出给logstash
IP为logstash服务器的IP;端口5044对应logstash上的配置
第4步: 启动服务
[root\@vm4 \~]# systemctl stop filebeat
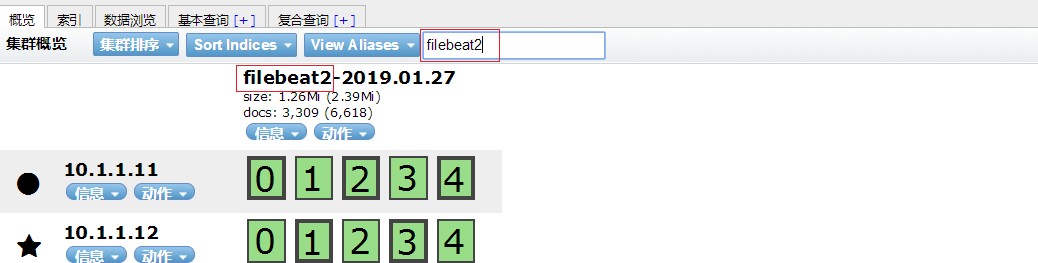
第5步: 去ES-head上验证
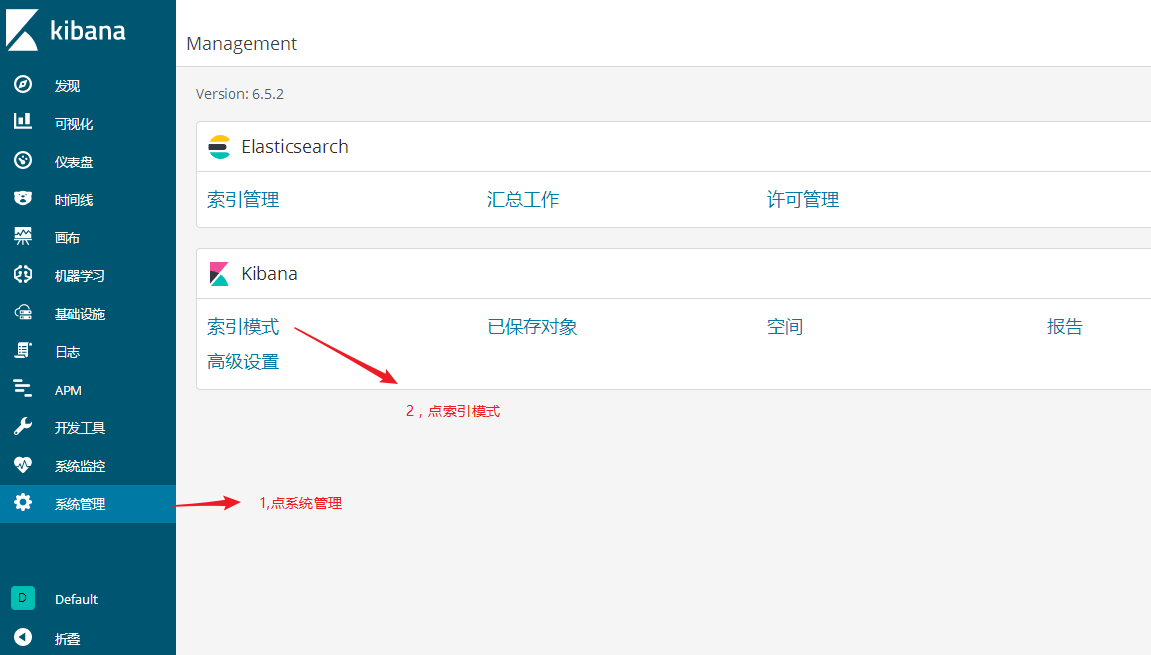
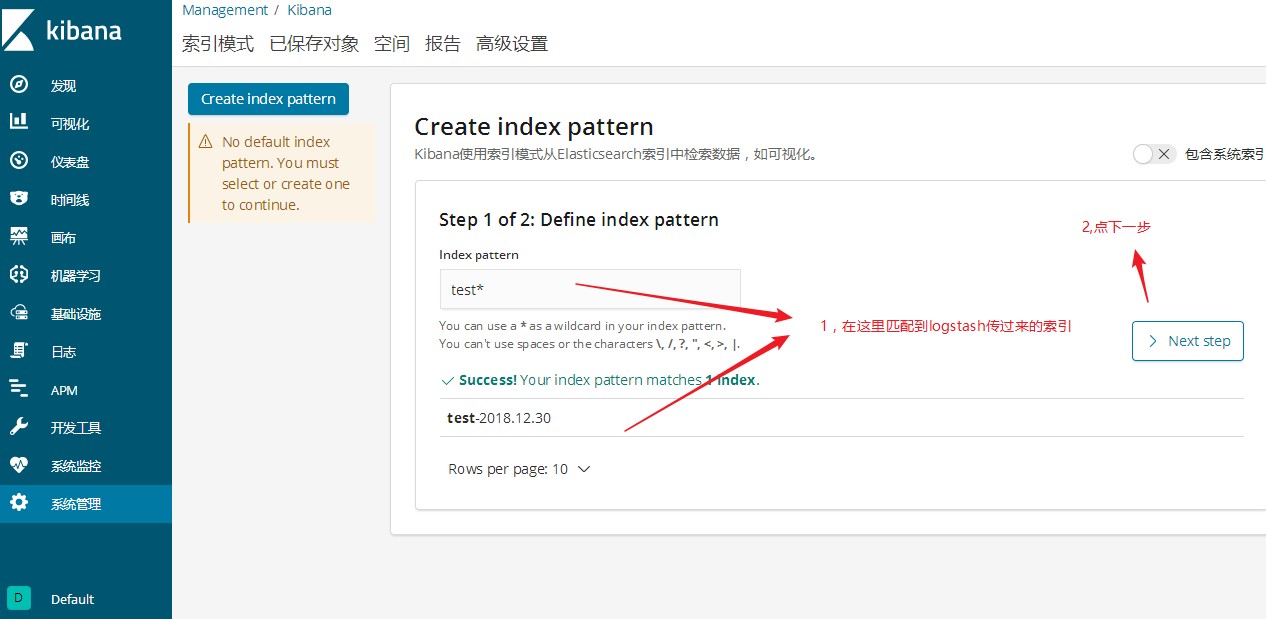
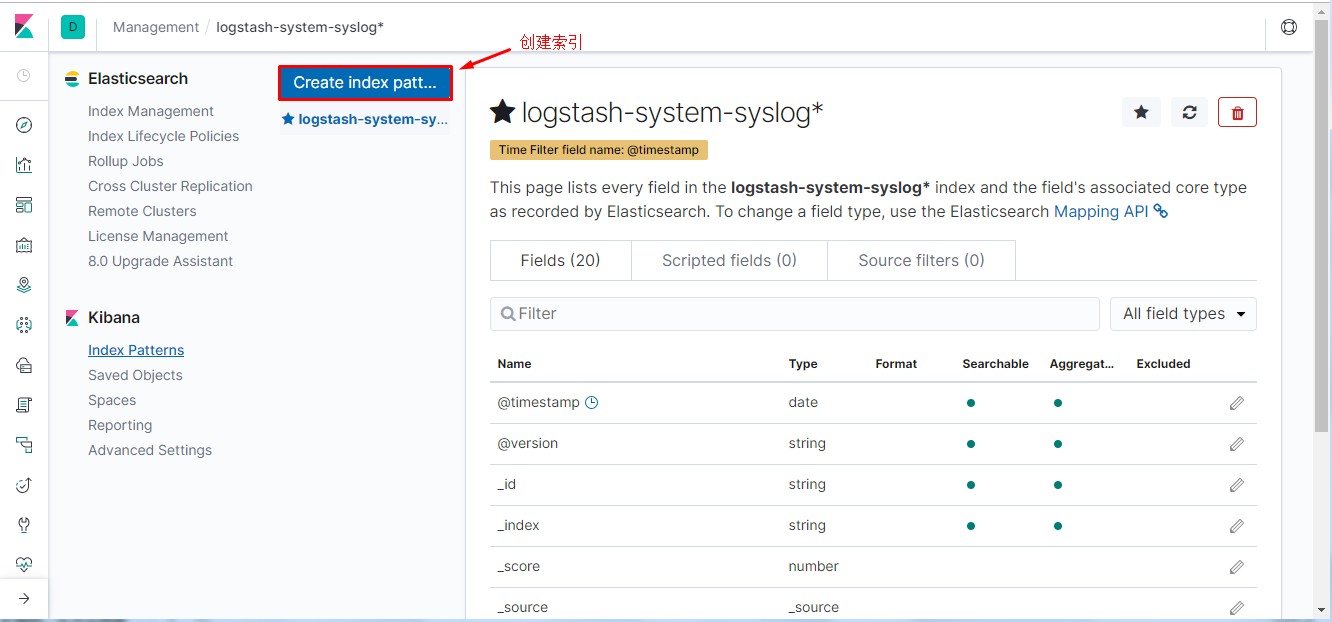
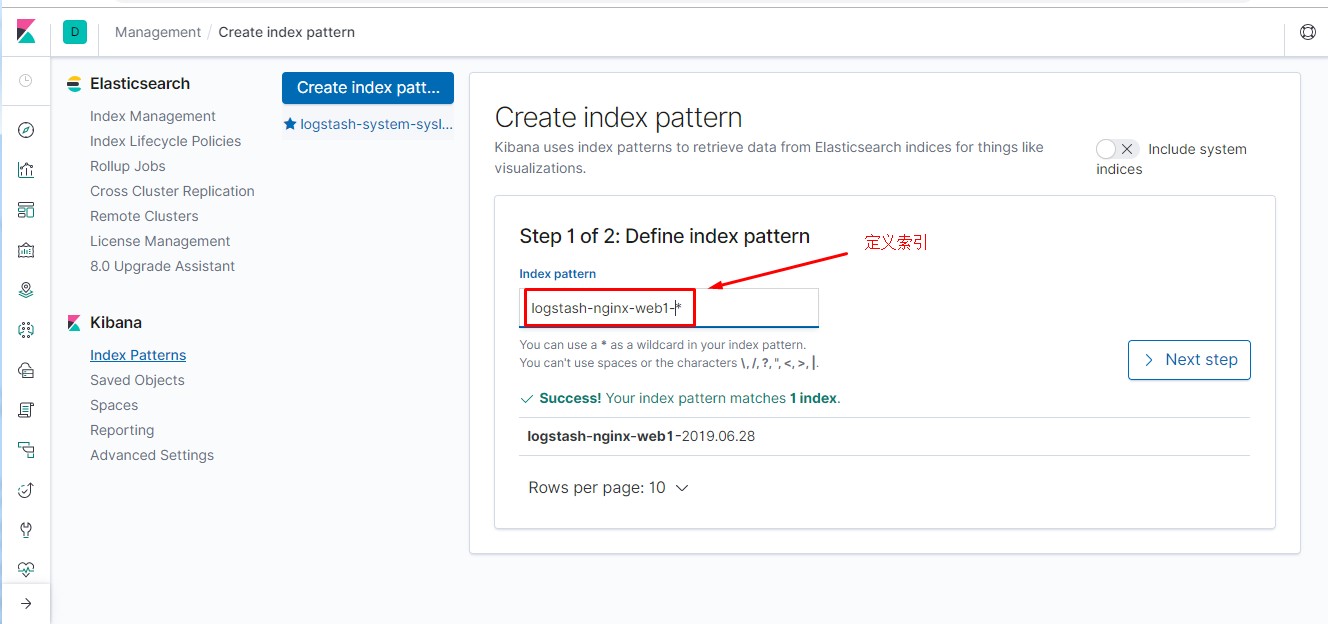
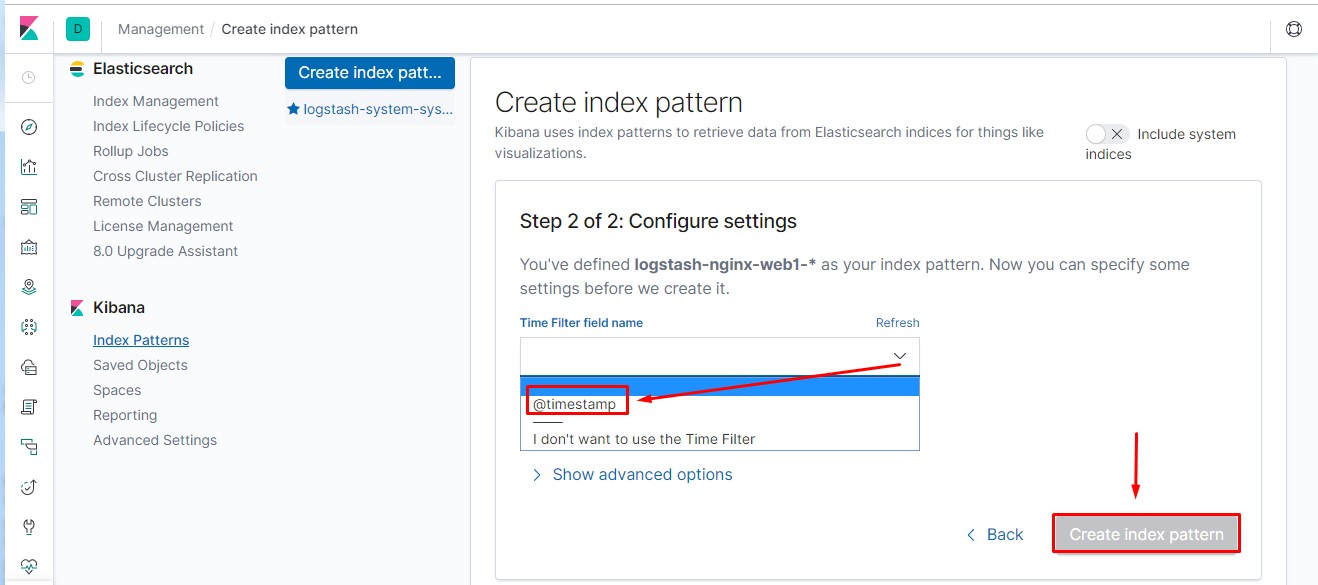
第6步:在kibana创建索引模式(过程省略,参考上面的笔记操作),然后点发现验证
1,
在?lebeat这台服务器上安装nginx,启动服务。并使用浏览器访问刷新一下,模拟产生一些相应的日志(强调:
我们在这里是模拟的实验环境,一定要搞清楚实际情况下是把?lebeat安装到nginx服务器上去收集日志)
[root\@vm4 \~]# yum install epel-release -y
[root\@vm4 \~]# yum install nginx -y
[root\@vm4 \~]# systemctl restart nginx
2, 修改?lebeat配置文件,并重启服务
[root\@vm4 \~]# cat /etc/filebeat/filebeat.yml |grep -v ‘#‘ |grep -v ‘\^\$‘
filebeat.inputs:
- type: log enabled: true paths:
- /var/log/*.log
- /var/log/nginx/access.log filebeat.config.modules:
path: \${path.config}/modules.d/*.yml reload.enabled: false
setup.template.settings: index.number_of_shards: 3
setup.kibana:
host: "10.1.1.11:5601"
output.logstash:
hosts: ["10.1.1.13:5044"]
processors:
- add_host_metadata: \~
其它的配置我都没变,只在这里加了一句nginx日志路径
19
20
21
22
- add_cloud_metadata: \~
[root\@vm4 \~]# systemctl stop filebeat
[root\@vm4 \~]# systemctl start filebeat
3, 验证(在kibana或es-head上查询) 练习: 尝试收集httpd,mysql日志
最后实验易产生的问题总结:
?lebeat配置里没有把output.elasticsearch改成output.logstash
?lebeat在收集/var/log/*.log日志时,需要对日志进行数据的改变或增加,才会传。当/var/log/yum.log增加了
日志数据会传输,但不会触发配置里的其它日志传输。(每个日志的传输是独立的)?lebeat收集的日志没有定义索引名称,
我这个实验是在logstash里定义的。(此例我定义的索引名叫?lebeat2-%{+YYYY.MM.dd})
es-head受资源限制可能会关闭了,你在浏览器上验证可能因为缓存问题,看不到变化的结果。
区分索引名和索引模式(index pattern)名
过滤器插件主要处理流经当前Logstash的事件信息,可以添加字段、移除字段、转换字段类型,通过正则表达式切分
数据等,也可以根据条件判断来进行不同的数据处理方式。
grok是Logstash中将非结构化数据解析成结构化数据以便于查询的最好工具,非常适合解析syslog日志,apache日
志,mysql日志,以及一些其他的web日志。
在?lebeat上配置,并重启
[root\@vm4 \~]# cat /etc/filebeat/filebeat.yml |grep -v ‘#‘ |grep -v ‘\^\$‘
filebeat.inputs:
- type: log enabled: true
paths:
- /var/log/nginx/access.log filebeat.config.modules:
path: \${path.config}/modules.d/*.yml
reload.enabled: false
只收集nginx的访问日志
setup.template.settings: index.number_of_shards: 3
setup.kibana:
host: "10.1.1.11:5601"
output.logstash:
hosts: ["10.1.1.13:5044"]
processors:
add_host_metadata: \~
[root\@vm4 \~]# systemctl stop filebeat
[root\@vm4 \~]# systemctl start filebeat
filter {
grok { add_field =\> {
"Device" =\> "my nginx web log"
}
}
output {
elasticsearch {
hosts =\> ["10.1.1.12:9200"]
index =\> "nginx-grok-%{+YYYY.MM.dd}"
}
}
[root\@vm3 \~]# cd /usr/share/logstash/bin/ [root\@vm3 bin]# pkill java
[root\@vm3 bin]# ./logstash --path.settings /etc/logstash/ -f
/etc/logstash/conf.d/test.conf &
[root\@vm3 \~]# vim /etc/logstash/conf.d/test.conf input {
beats {
port =\> 5044
}
}
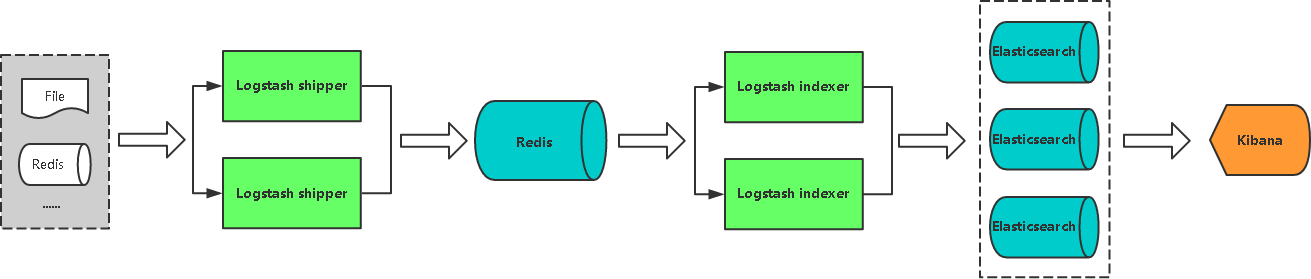
扩展一:使用Redis参与数据收集
优势:
在多台服务器,大量日志情况下可减少对ES压力,队列起到缓冲作用,也可以一定程度保护数据不丢失。(当
Logstash接收数据能力超过ES处理能力时,可增加队列均衡网络传输)
redis安装
# yum install redis –y
# vi /etc/redis/redis.conf bind 0.0.0.0
requirepass 123456 #480 line
# systemctl start redis # systemctl enable redis
# redis-cli -a 123456 127.0.0.1:6379\> keys *
(empty list or set)
#安装redis需要使用epel源
logstash output 至redis 在被采集主机安装logstash
# cat /etc/logstash/conf.d/logstash_to_redis.conf
input {
file {
path =\> ["/var/log/messages"] type =\> "system"
tags =\> ["syslog","test"] start_position =\> "beginning"
}
file {
path =\> ["/var/log/audit/audit.log"] type =\> "system"
tags =\> ["auth","test"] start_position =\> "beginning"
}
}
filter {
}
output {
redis {
host =\> ["redis_host_ip:6379"] password =\> "123456"
db =\> "0"
data_type =\> "list" key =\> "logstash"
}
}
#执行
# /usr/share/logstash/bin/logstash --path.settings /etc/logstach -r -f
/etc/logstash/conf.d/logstash_to_redis.conf
3
1 #在redis主机验证收集到的数据情况 2 127.0.0.1:6379\> keys *
3 1) "logstash"
4 127.0.0.1:6379\> llen logstash
5 (integer) 6026 6
logstash from redis
在logstash所在主机读取redis主机内容
filter {
}
output {
if [type] == "system" {
if [tags][0] == "syslog" { elasticsearch {
hosts =\> ["http://es1:9200","http://es2:9200","http://es3:9200"] index =\>
"logstash-system-syslog-%{+YYYY.MM.dd}"}
stdout { codec=\> rubydebug }
}
else if [tags][0] == "auth" { elasticsearch {
hosts =\> ["http://es1:9200","http://es2:9200","http://es3:9200"] index =\>
"logstash-system-auth-%{+YYYY.MM.dd}"}
stdout { codec=\> rubydebug }
}
}
}
# cat /etc/logstash/conf.d/logstash_from_redis.conf input {
redis {
host =\> "redis_host_ip" port =\> 6379
password =\> "123456"
db =\> "0"
data_type =\> "list" key =\> "logstash"
}
}
#执行
# ./logstash --path.settings /etc/logstash -r -f
/etc/logstash/conf.d/logstash_from_redis.conf
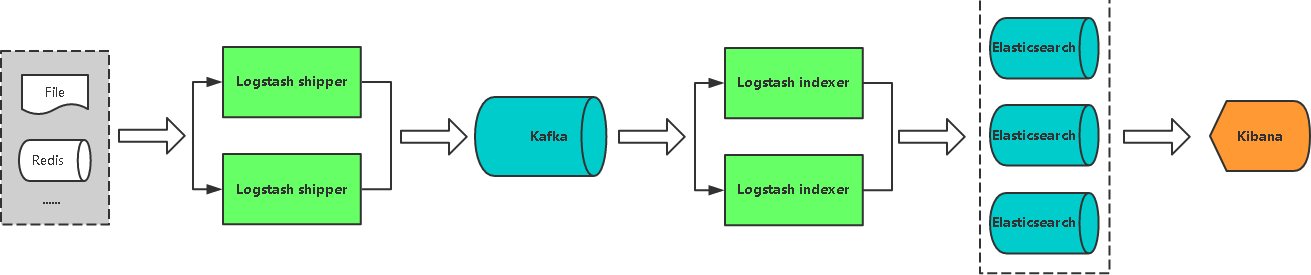
采用Kafka做缓冲队列,相比Redis更适合大吞吐量。
?lebeat配置
filebeat.inputs:
type: log enabled: true paths:
/var/log/messages tags: ["syslog","test"] fields:
type: system fields_under_root: true
type: log enabled: true paths:
/var/log/audit/audit.log tags: ["auth","test"] fields:
type: system fields_under_root: true
output.redis:
hosts: ["redis_host_ip"] password: "123456"
key: "filebeat" db: 0
datatype: list
#cat /etc/filebeat/filebeat.yaml
logstash配置
# cat /etc/logstash/conf.d/logstash_from_redis.conf input {
redis {
host =\> "redis_host_ip" port =\> 6379
password =\> "123456"
db =\> "0"
data_type =\> "list" key =\> "filebeat"
}
}
filter {
}
output {
if [type] == "system" {
if [tags][0] == "syslog" { elasticsearch {
hosts =\> ["http://es1:9200","http://es2:9200","http://es3:9200"] index =\>
"logstash-system-syslog-%{+YYYY.MM.dd}"}
stdout { codec=\> rubydebug }
}
else if [tags][0] == "auth" { elasticsearch {
hosts =\> ["http://es1:9200","http://es2:9200","http://es3:9200"] index =\>
"logstash-system-auth-%{+YYYY.MM.dd}"}
stdout { codec=\> rubydebug }
}
}
}
收集nginx日志
#安装nginx
#为了提高对日志处理效率,可以使用日志格式化完成对日志生成JSON,不建议使用正则表达式
# cat /etc/nginx/nginx.conf
...
http {
log_format
main
‘\$remote_addr - \$remote_user [\$time_local] "\$request" ‘ ‘\$status
\$body_bytes_sent "\$http_referer" ‘
‘"\$http_user_agent" "\$http_x_forwarded_for"‘;
log_format json ‘{ "\@timestamp": "\$time_iso8601", ‘ ‘"remote_addr":
"\$remote_addr", ‘ ‘"remote_user": "\$remote_user", ‘ ‘"body_bytes_sent":
"\$body_bytes_sent", ‘‘"request_time": "\$request_time", ‘
‘"status": "\$status", ‘ ‘"request_uri": "\$request_uri", ‘
‘"request_method": "\$request_method", ‘ ‘"http_referrer": "\$http_referer",
‘ ‘"http_x_forwarded_for": "\$http_x_forwarded_for", ‘ ‘"http_user_agent":
"\$http_user_agent"}‘;
access_log /var/log/nginx/access.log json;
...
1 #启动nginx并访问,观察日志输出 2
# systemctl start nginx
# systemctl status nginx 5
#访问
浏览器访问 nginx服务器
8
9 #查看日志输出10
11 # tail -f /var/log/nginx/access.log
12 { "\@timestamp": "2019-06-29T07:16:00+08:00", "remote_addr":
"192.168.216.1",
"remote_user": "-", "body_bytes_sent": "3700", "request_time": "0.000",
"status":
"200", "request_uri": "/", "request_method": "GET", "http_referrer": "-",
"http_x_forwarded_for": "-", "http_user_agent": "Mozilla/5.0 (Windows NT
6.1; Win64; x64) AppleWebKit/537.36 (KHTML, like Gecko) Chrome/75.0.3770.100
Safari/537.36"}
13 { "\@timestamp": "2019-06-29T07:16:00+08:00", "remote_addr":
"192.168.216.1",
"remote_user": "-", "body_bytes_sent": "368", "request_time": "0.000",
"status": "200", "request_uri": "/nginx-logo.png", "request_method": "GET",
"http_referrer": "http://192.168.216.145/",
"http_x_forwarded_for": "-", "http_user_agent": "Mozilla/5.0 (Windows NT
6.1; Win64; x64) AppleWebKit/537.36 (KHTML, like Gecko) Chrome/75.0.3770.100
Safari/537.36"}
14 { "\@timestamp": "2019-06-29T07:16:00+08:00", "remote_addr":
"192.168.216.1",
"remote_user": "-", "body_bytes_sent": "2811", "request_time": "0.000",
"status": "200", "request_uri": "/poweredby.png", "request_method": "GET",
"http_referrer": "http://192.168.216.145/",
"http_x_forwarded_for": "-", "http_user_agent": "Mozilla/5.0 (Windows NT
6.1; Win64; x64) AppleWebKit/537.36 (KHTML, like Gecko) Chrome/75.0.3770.100
Safari/537.36"}
15
#通过filebeat进行收集
# cat /etc/filebeat/filebeat.yml filebeat.inputs:
- type: log
enabled: true paths:
- /var/log/nginx/access.log tags: ["nginx","web1"] fields:
type: nginx
fields_under_root: true
output.redis:
hosts: ["redis_host_ip"] password: "123456"
key: "filebeat" db: 0
datatype: list
filter {
}
output {
if [type] == "nginx" {
if [tags][1] == "web1" { elasticsearch {
hosts =\> ["http://es1:9200","http://es2:9200"] index =\>
"logstash-nginx-web1-%{+YYYY.MM.dd}"}
stdout { codec=\> rubydebug }
}
}
}
#logstash进行转发
# cat /etc/logstash/conf.d/filebeat_redis_logstash_nginx.conf input {
redis {
host =\> "redis_host_ip" port =\> 6379
password =\> "123456"
db =\> "0"
data_type =\> "list" key =\> "filebeat"
}
}
可能通过elasticsearch_head进行验证

input {
redis {
host =\> "redis_host_ip"
4 port =\> 6379
5 password =\> "123456"
6 db =\> "0"
data_type =\> "list"
10 }
filter {
if [app] == "www" {
if [type] == "nginx-access" { grok {
match =\> {
"message" =\> "%{IPV4:remote_addr} - (%{USERNAME:remote_user}|-) \[%
{HTTPDATE:time_local}\] \"%{WORD:request_method} %{URIPATHPARAM:request_uri}
HTTP/%
{NUMBER:http_protocol}\" %{NUMBER:http_status} %{NUMBER:body_bytes_sent} \"%
{GREEDYDATA:http_referer}\" \"%{GREEDYDATA:http_user_agent}\" \"(%
{IPV4:http_x_forwarded_for}|-)\""
}
overwrite =\> ["message"]
}
geoip {
source =\> "remote_addr" target =\> "geoip"
database =\> "/opt/GeoLite2-City.mmdb"
add_field =\> ["[geoip][coordinates]", "%{[geoip][longitude]}"] add_field
=\> ["[geoip][coordinates]", "%{[geoip][latitude]}"]
}
date {
locale =\> "en"
match =\> ["time_local", "dd/MMM/yyyy:HH:mm:ss Z"]
}
mutate {
convert =\> ["[geoip][coordinates]", "float"]
}
}
}
}
output { elasticsearch {
hosts =\> ["http://es1:9200","http://es2:9200"] index =\>
"logstash-%{type}-%{+YYYY.MM.dd}"}
stdout{codec =\> rubydebug }
}
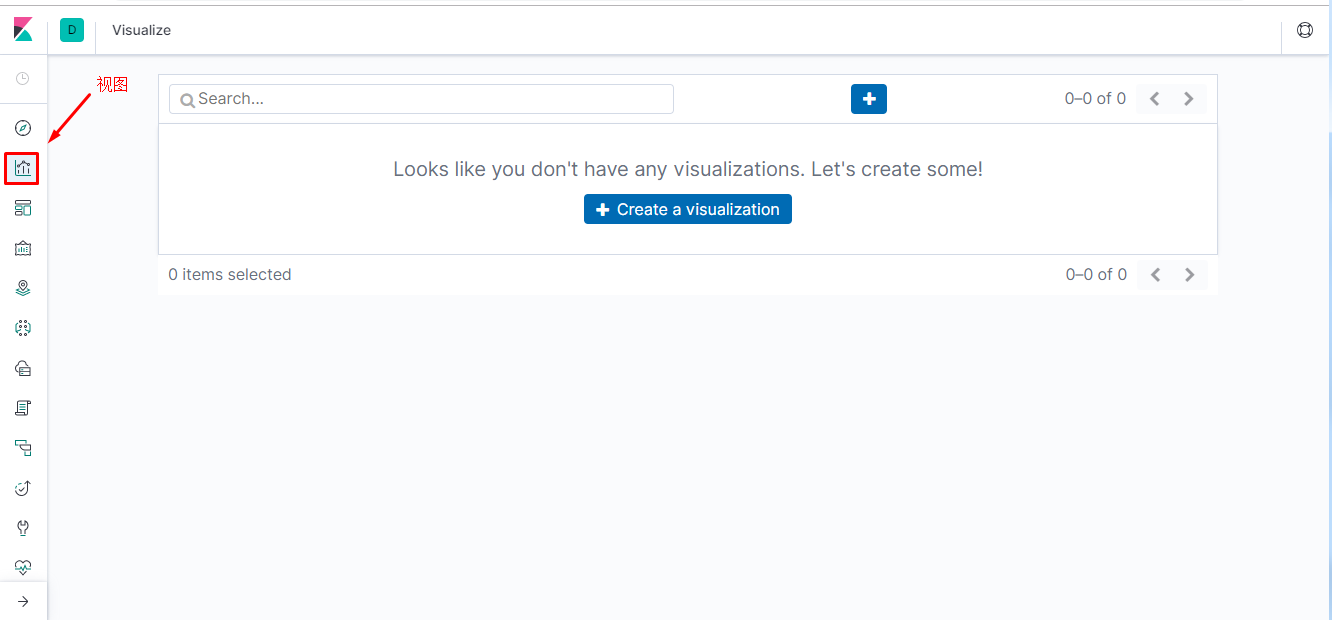
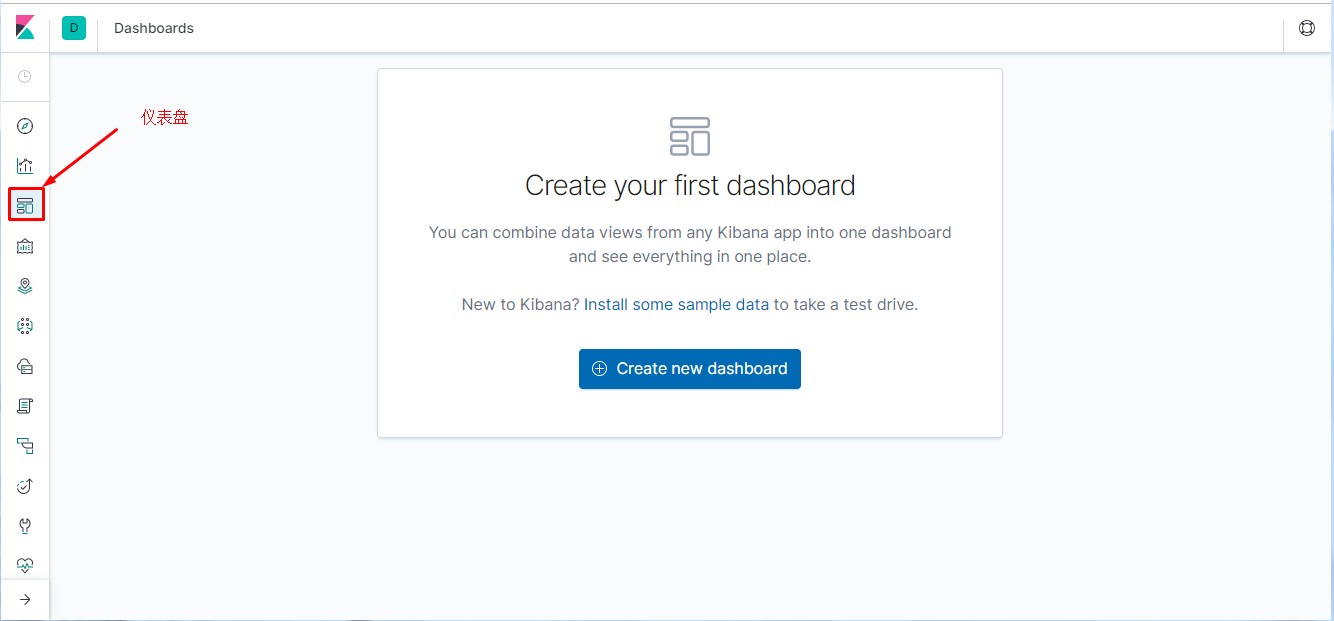
生成图形
通过kibana界面先添加nginx相关索引,具备相关信息后才可操作。


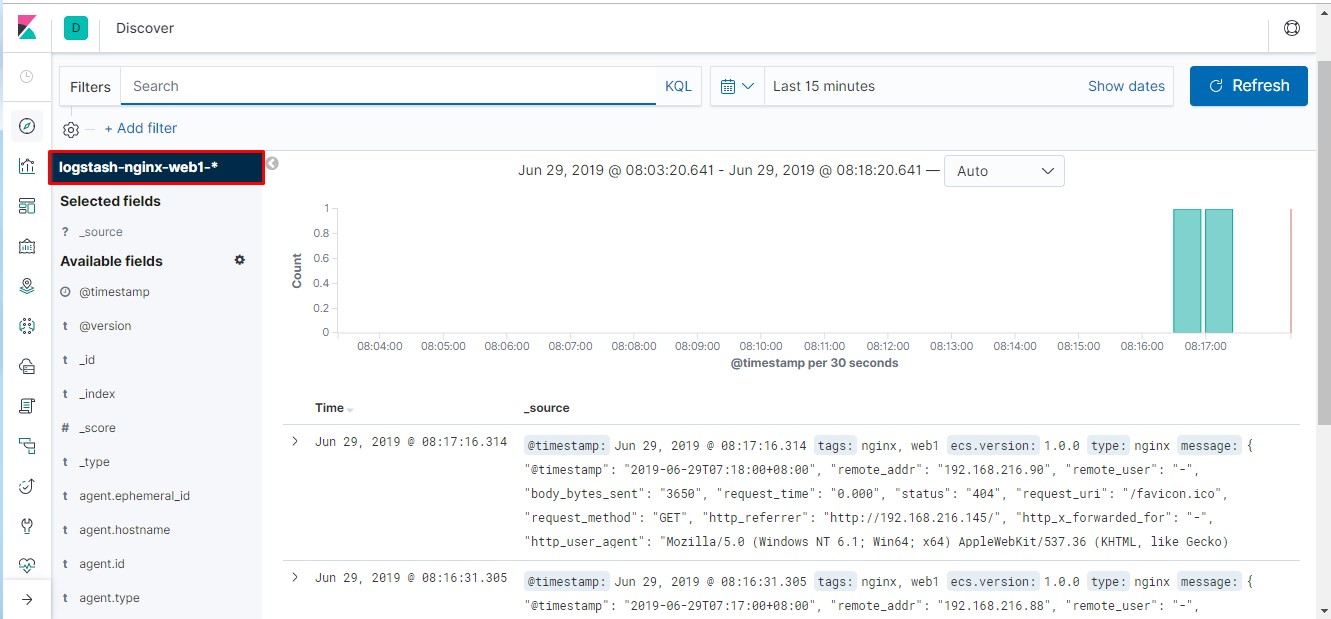
1 #通过此方法模拟多用户访问
2 # echo ‘{ "\@timestamp": "2019-06-29T07:18:00+08:00", "remote_addr":
"192.168.216.90", "remote_user": "-", "body_bytes_sent": "3650",
"request_time": "0.000", "status": "404", "request_uri": "/favicon.ico",
"request_method": "GET", "http_referrer":
"http://192.168.216.145/",
"http_x_forwarded_for": "-", "http_user_agent": "Mozilla/5.0 (Windows NT
6.1; Win64; x64) AppleWebKit/537.36 (KHTML, like Gecko) Chrome/75.0.3770.100
Safari/537.36"}‘ \>\> /var/log/nginx/access.log
原文:https://blog.51cto.com/14625831/2549443