~]# git clone https://github.com/imirsh/kube-prometheus.git
~]# kubectl  apply -f kube-prometheus/manifests/setup
~]# kubectl  apply -f kube-prometheus/manifests
~]# kubectl  get svc -n monitoring
NAME                    TYPE        CLUSTER-IP       EXTERNAL-IP   PORT(S)                      AGE
alertmanager-main       ClusterIP   10.98.140.5      <none>        9093/TCP                     107s
alertmanager-operated   ClusterIP   None             <none>        9093/TCP,9094/TCP,9094/UDP   107s
grafana                 NodePort    10.98.43.167     <none>        3000:31136/TCP               107s
kube-state-metrics      ClusterIP   None             <none>        8443/TCP,9443/TCP            106s
node-exporter           ClusterIP   None             <none>        9100/TCP                     106s
prometheus-adapter      ClusterIP   10.107.224.40    <none>        443/TCP                      106s
prometheus-k8s          NodePort    10.102.209.143   <none>        9090:32612/TCP               105s
prometheus-operated     ClusterIP   None             <none>        9090/TCP                     105s
prometheus-operator     ClusterIP   None             <none>        8443/TCP                     2m42s
访问 Prometheus: http://IP:32612/
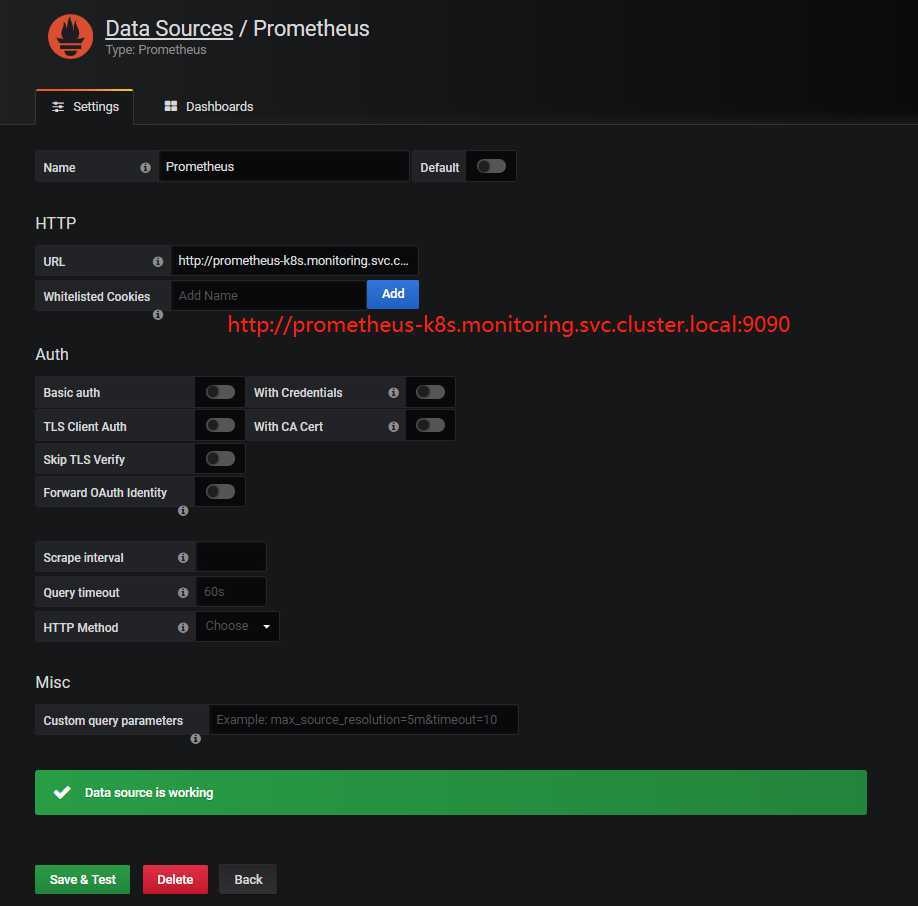
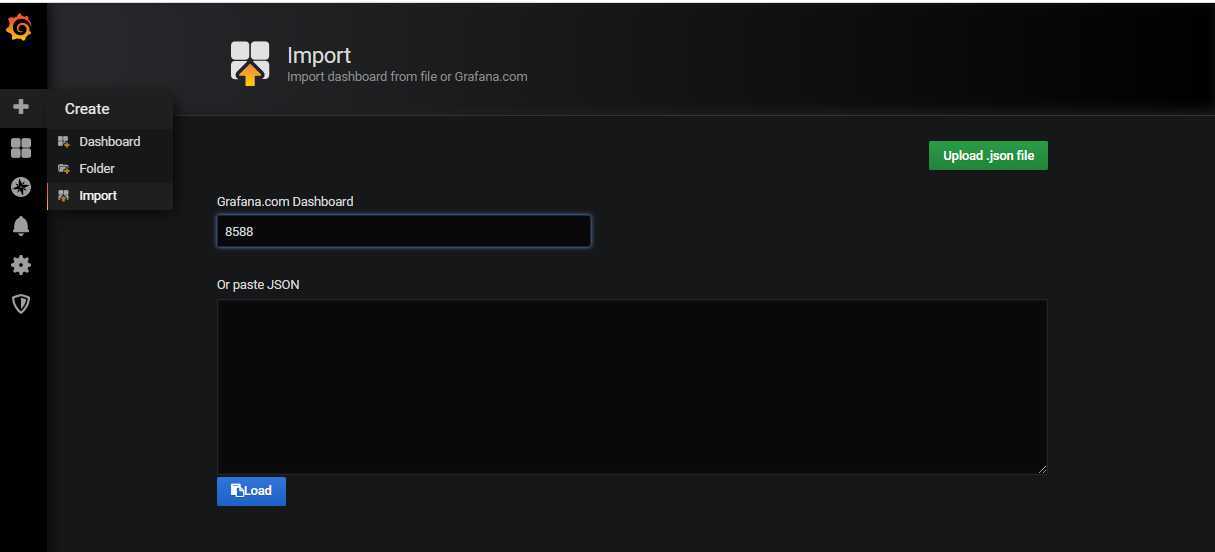
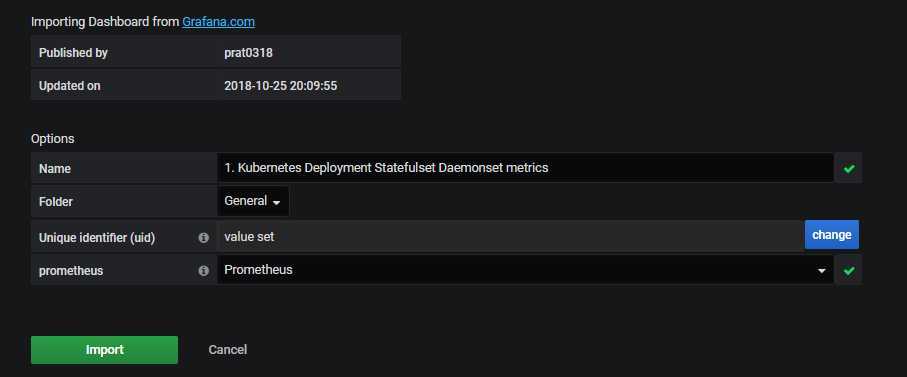
访问 Grafana:http://IP:31136
默认账号密码:admin/admin

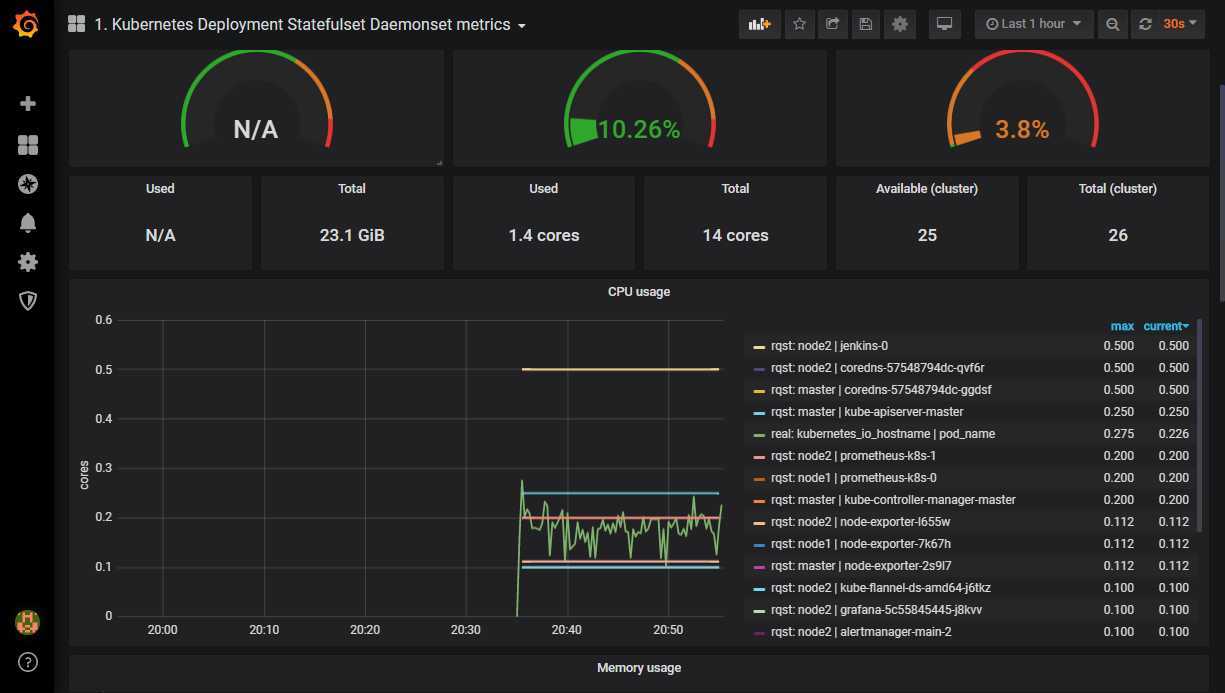
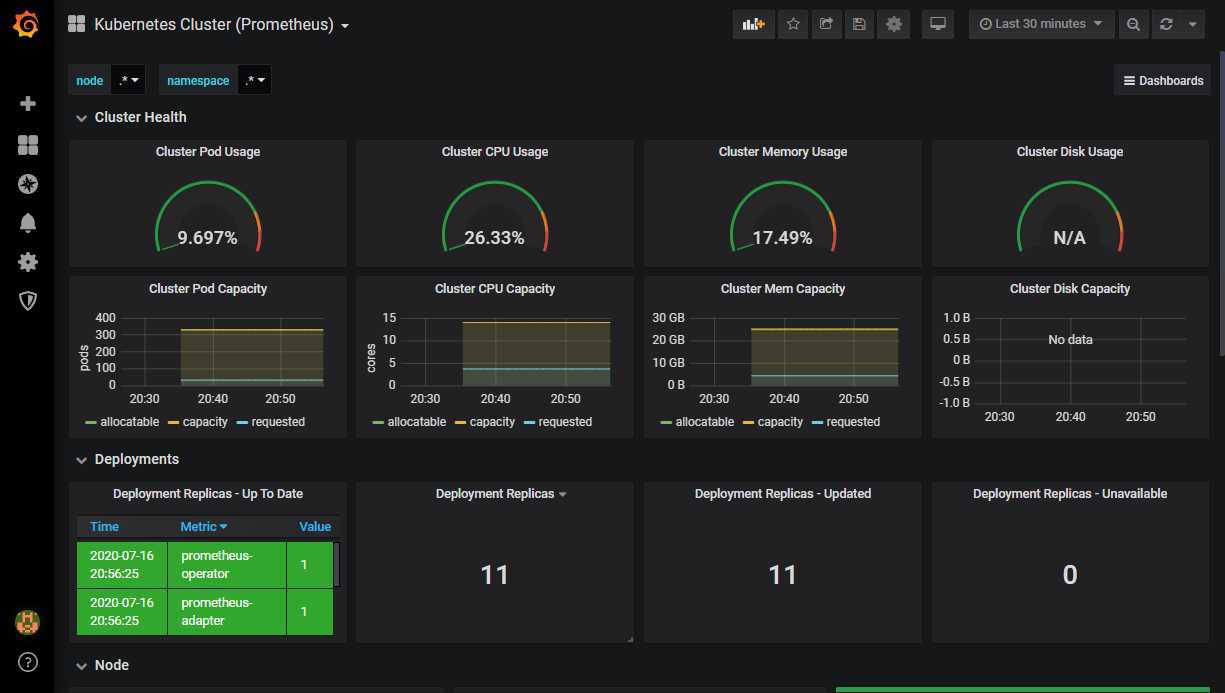
使用 Prometheus 监控 kubernetes 集群
原文:https://www.cnblogs.com/imirsh/p/13325046.html