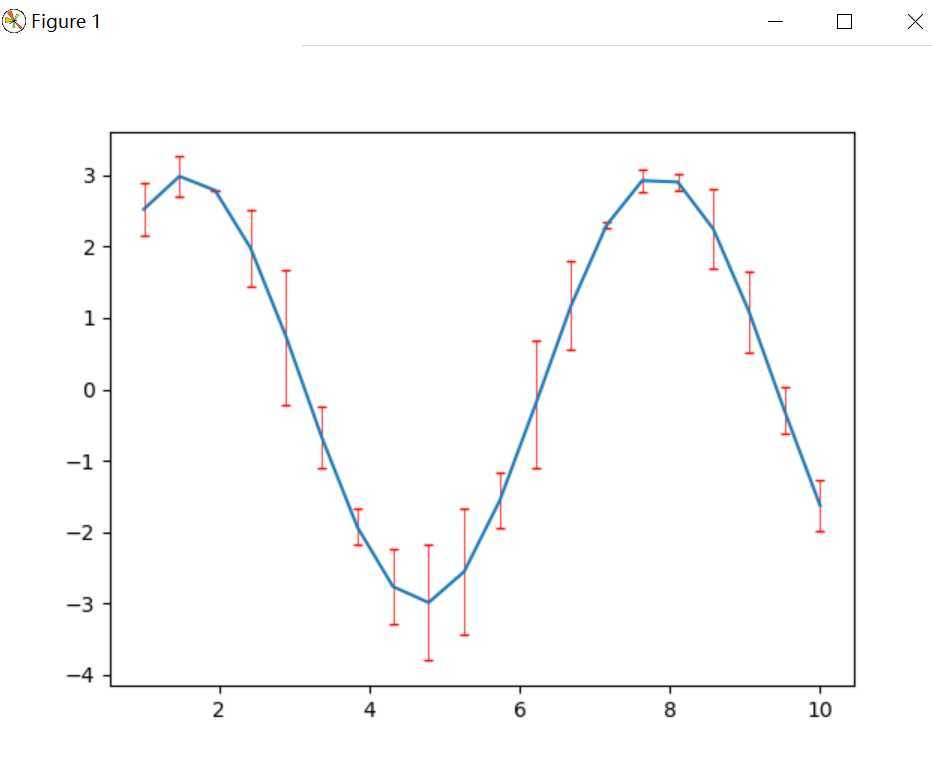
"""plt.errorbar(x, y, yerr = , xerr = , fmt = "", ecolor = , elinewidth = None, capsize = None, capthick = None,) # this is the whole function
标准差: standard deviation
标准误: standard error
x: 横坐标
y: 纵坐标
fmt: 各数据点之间连接的形式
elinewidth: 方差线的宽度
capsize: 标准差线终点两个横线的长度
capthick: 标准差线终点两个横线的厚度
xerr: x坐标的标准差,上下各一个标准差
yerr: y坐标的标准差,上下各一个标准差
"""

import matplotlib.pyplot as plt
import numpy as np

x = np.linspace(1,10,20)
y = np.sin(x) * 3
std = np.random.rand(20)

plt.errorbar(x, y, yerr = std, fmt = "-", ecolor = "red", elinewidth = 0.5, capsize = 2, capthick = 1)
plt.show()

# 转自: https://blog.csdn.net/weixin_38314865/article/details/104869284
原文:https://www.cnblogs.com/zijidefengge/p/13288734.html