参考文章:https://cloud.tencent.com/developer/article/1446127
pandas包含两种数据类型:series和dataframe。
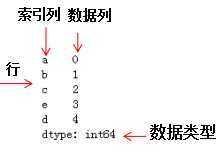
series结构名称:
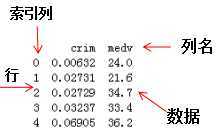
dataframe是一种二维数据结构,数据以表格形式(与excel类似)存储,有对应的行和列。dataframe结构名称:
mylist = list(‘abcedfghijklmnopqrstuvwxyz‘)   # 列表
myarr = np.arange(26)                          # 数组
mydict = dict(zip(mylist, myarr))             # 字典

# 构建方法
ser1 = pd.Series(mylist)
ser2 = pd.Series(myarr)
ser3 = pd.Series(mydict)
print(ser3.head())                 # 打印前5个数据

#>  a    0
    b    1
    c    2
    d    4
    e    3
    dtype:int64
mylist = list(‘abcedfghijklmnopqrstuvwxyz‘)
myarr = np.arange(26)
mydict = dict(zip(mylist, myarr))
ser = pd.Series(mydict)

# series转换为dataframe
df = ser.to_frame()
# 索引列转换为dataframe的列
df.reset_index(inplace=True)
print(df.head())

#>      index  0
    0     a  0
    1     b  1
    2     c  2
    3     e  3
    4     d  4
# 构建series1
ser1 = pd.Series(list(‘abcedfghijklmnopqrstuvwxyz‘))
# 构建series2
ser2 = pd.Series(np.arange(26))

# 方法1,axis=1表示列拼接,0表示行拼接
df = pd.concat([ser1, ser2], axis=1)

# 与方法1相比,方法2设置了列名
df = pd.DataFrame({‘col1‘: ser1, ‘col2‘: ser2})
print(df.head())

#>      col1  col2
    0    a     0
    1    b     1
    2    c     2
    3    e     3
    4    d     4
ser = pd.Series(list(‘abcedfghijklmnopqrstuvwxyz‘))

# 命名索引列名称
ser.name = ‘alphabets‘
# 显示前5行数据
ser.head()

#>    0    a
    1    b
    2    c
    3    e
    4    d
    Name: alphabets, dtype: object
ser1 = pd.Series([1, 2, 3, 4, 5])
ser2 = pd.Series([4, 5, 6, 7, 8])

# 返回ser1不包含ser2的布尔型series
ser3=~ser1.isin(ser2)
# 获取ser不包含ser2的元素
ser1[ser3]

#>    0    1
    1    2
    2    3
    dtype: int64
ser1 = pd.Series([1, 2, 3, 4, 5])
ser2 = pd.Series([4, 5, 6, 7, 8])

# 求ser1和ser2的并集
ser_u = pd.Series(np.union1d(ser1, ser2))
# 求ser1和ser2的交集
ser_i = pd.Series(np.intersect1d(ser1, ser2))
# ser_i在ser_u的补集就是ser1和ser2不相同的项
ser_u[~ser_u.isin(ser_i)]

#>    0    1
    1    2
    2    3
    5    6
    6    7
    7    8
    dtype: int64
# 设置随机数种子
state = np.random.RandomState(100)
# 从均值为5标准差为25的正态分布随机抽取5个点构成series
ser = pd.Series(state.normal(10, 5, 25))
# 求ser的四分位数
np.percentile(ser, q=[0, 25, 50, 75, 100])

#> array([ 1.25117263,  7.70986507, 10.92259345, 13.36360403, 18.0949083 ])
#从0~7随机抽取30个列表值,组成series
ser = pd.Series(np.take(list(‘abcdefgh‘), np.random.randint(8, size=30)))
# 对该series进行计数
ser.value_counts()

#>    d    8
    g    6
    b    6
    a    5
    e    2
    h    2
    f    1
    dtype: int64
np.random.RandomState(100)
# 从1~4均匀采样12个点组成series
ser = pd.Series(np.random.randint(1, 5, [12]))
# 除前两行索引对应的值不变,后几行索引对应的值为Other
ser[~ser.isin(ser.value_counts().index[:2])] = ‘Other‘
ser

#>    0     Other
    1         4
    2         2
    3         2
    4         4
    5     Other
    6     Other
    7     Other
    8         4
    9         4
    10        4
    11        2
    dtype: object
换个角度理解,对数值series离散化成10个类别(categorical)值
ser = pd.Series(np.random.random(20))

# 离散化10个类别值,只显示前5行的数据
pd.qcut(ser, q=[0, .10, .20, .3, .4, .5, .6, .7, .8, .9, 1],
        labels=[‘1st‘, ‘2nd‘, ‘3rd‘, ‘4th‘, ‘5th‘, ‘6th‘, ‘7th‘, ‘8th‘, ‘9th‘, ‘10th‘]).head()

#>
0    3rd
1    1st
2    6th
3    6th
4    9th
dtype: category
Categories (10, object): [1st < 2nd < 3rd < 4th ... 7th < 8th < 9th < 10th]
ser = pd.Series(np.random.randint(1, 10, 35))
# serier类型转换numpy类型,然后重构
df = pd.DataFrame(ser.values.reshape(7,5))
print(df)

#>       0  1  2  3  4
    0  1  2  1  2  5
    1  1  2  4  5  2
    2  1  3  3  2  8
    3  8  6  4  9  6
    4  2  1  1  8  5
    5  3  2  8  5  6
    6  1  5  5  4  6
ser = pd.Series(np.random.randint(1, 10, 7))
print(ser)

# 获取值是3倍数的索引
np.argwhere(ser % 3==0)

#>    0    6
    1    8
    2    6
    3    7
    4    6
    5    2
    6    4
    dtype: int64

#>    array([[0],
           [2],
           [4]])
ser = pd.Series(list(‘abcdefghijklmnopqrstuvwxyz‘))
index = [0, 4, 8, 14, 20]

# 获取指定索引的元素
ser.take(index)

#>    0     a
    4     e
    8     i
    14    o
    20    u
    dtype: object
ser1 = pd.Series(range(5))
ser2 = pd.Series(list(‘abcde‘))

# 垂直拼接
df = pd.concat([ser1, ser2], axis=0)

# 水平拼接
df = pd.concat([ser1, ser2], axis=1)
print(df)

#>       0  1
    0  0  a
    1  1  b
    2  2  c
    3  3  d
    4  4  e
# ser1必须包含ser2,否则会报错
ser1 = pd.Series([10, 9, 6, 5, 3, 1, 12, 8, 13])
ser2 = pd.Series([1, 3, 10, 13])

# 方法 1
[np.where(i == ser1)[0].tolist()[0] for i in ser2]

# 方法 2
[pd.Index(ser1).get_loc(i) for i in ser2]

#> [5, 4, 0, 8]
truth = pd.Series(range(10))
pred = pd.Series(range(10)) + np.random.random(10)

# 均方差
np.mean((truth-pred)**2)

#> 0.25508722434194103
17.如何使series中每个元素的首字母为大写
# series的元素为str类型
ser = pd.Series([‘how‘, ‘to‘, ‘kick‘, ‘ass?‘])

# 方法 1
ser.map(lambda x: x.title())

# 方法 2 ,字符串相加
ser.map(lambda x: x[0].upper() + x[1:])

# 方法 3
pd.Series([i.title() for i in ser])

#>    0     How
    1      To
    2    Kick
    3    Ass?
    dtype: object
18.如何计算series中每个元素的字符串长度
ser = pd.Series([‘how‘, ‘to‘, ‘kick‘, ‘ass?‘])

# 方法
ser.map(lambda x: len(x))

#>    0    3
    1    2
    2    4
    3    4
    dtype: int64
19.如何计算series的一阶导和二阶导
ser = pd.Series([1, 3, 6, 10, 15, 21, 27, 35])

# 求一阶导并转化为列表类型
print(ser.diff().tolist())
# 求二阶导并转化为列表类型
print(ser.diff().diff().tolist())

#>    [nan, 2.0, 3.0, 4.0, 5.0, 6.0, 6.0, 8.0]
    [nan, nan, 1.0, 1.0, 1.0, 1.0, 0.0, 2.0]
20.如何将一系列日期字符串转换为timeseries
ser = pd.Series([‘01 Jan 2010‘, ‘02-02-2011‘, ‘20120303‘, ‘2013/04/04‘, ‘2014-05-05‘, ‘2015-06-06T12:20‘])

pd.to_datetime(ser)

#>    0   2010-01-01 00:00:00
    1   2011-02-02 00:00:00
    2   2012-03-03 00:00:00
    3   2013-04-04 00:00:00
    4   2014-05-05 00:00:00
    5   2015-06-06 12:20:00
    dtype: datetime64[ns]
21. 如何从一个series中获取至少包含两个元音的元素
ser = pd.Series([‘Apple‘, ‘Orange‘, ‘Plan‘, ‘Python‘, ‘Money‘])

# 方法
from collections import Counter
# Counter是一个类字典类型,键是元素值,值是元素出现的次数,满足条件的元素返回True
mask = ser.map(lambda x: sum([Counter(x.lower()).get(i, 0) for i in list(‘aeiou‘)]) >= 2)
ser[mask]

#>    0     Apple
    1    Orange
    4     Money
    dtype: object
22. 如何计算根据另一个series分组后的series均值
fruit = pd.Series(np.random.choice([‘apple‘, ‘banana‘, ‘carrot‘], 10))
weights = pd.Series(np.linspace(1, 10, 10))

# 根据fruit对weight分组
weightsGrouped = weights.groupby(fruit)
print(weightsGrouped.indices)
# 对分组后series求每个索引的平均值
weightsGrouped.mean()

#>    {‘apple‘: array([0, 3], dtype=int64), ‘banana‘: array([1, 2, 4, 8],
 dtype=int64), ‘carrot‘: array([5, 6, 7, 9], dtype=int64)}

#>    apple     2.50
    banana    4.75
    carrot    7.75
    dtype: float64
23. 如何计算两个series之间的欧氏距离
p = pd.Series([1, 2, 3, 4, 5, 6, 7, 8, 9, 10])
q = pd.Series([10, 9, 8, 7, 6, 5, 4, 3, 2, 1])

# 方法1
sum((p - q)**2)**.5

# 方法2
np.linalg.norm(p-q)

#>    18.16590212458495
24. 如何在数值series中找局部最大值
局部最大值对应二阶导局部最小值
ser = pd.Series([2, 10, 3, 4, 9, 10, 2, 7, 3])

# 二阶导
dd = np.diff(np.sign(np.diff(ser)))
# 二阶导的最小值对应的值为最大值,返回最大值的索引
peak_locs = np.where(dd == -2)[0] + 1
peak_locs

#>    array([1, 5, 7], dtype=int64)
25. 如何用最少出现的字符替换空格符
my_str = ‘dbc deb abed gade‘

# 方法
ser = pd.Series(list(‘dbc deb abed gade‘))
# 统计元素的频数
freq = ser.value_counts()
print(freq)
# 求最小频数的字符
least_freq = freq.dropna().index[-1]
# 替换
"".join(ser.replace(‘ ‘, least_freq))

#>    d    4
         3
    b    3
    e    3
    a    2
    c    1
    g    1
    dtype: int64

#>    ‘dbcgdebgabedggade‘
26. 如何计算数值series的自相关系数
ser = pd.Series(np.arange(20) + np.random.normal(1, 10, 20))

# 求series的自相关系数,i为偏移量
autocorrelations = [ser.autocorr(i).round(2) for i in range(11)]
print(autocorrelations[1:])
# 选择最大的偏移量
print(‘Lag having highest correlation: ‘, np.argmax(np.abs(autocorrelations[1:]))+1)

#>    [0.33, 0.41, 0.48, 0.01, 0.21, 0.16, -0.11, 0.05, 0.34, -0.24]
#>    Lag having highest correlation:  3
27. 如何对series进行算术运算操作
# 如何对series之间进行算法运算
import pandas as pd
series1 = pd.Series([3,4,4,4],[‘index1‘,‘index2‘,‘index3‘,‘index4‘])
series2 = pd.Series([2,2,2,2],[‘index1‘,‘index2‘,‘index33‘,‘index44‘])
# 加法
series_add = series1 + series2
print(series_add)
# 减法
series_minus = series1 - series2
# series_minus
# 乘法
series_multi = series1 * series2
# series_multi
# 除法
series_div = series1/series2
series_div
series是基于索引进行算数运算操作的,pandas会根据索引对数据进行运算,若series之间有不同的索引,对应的值就为Nan。结果如下:
#加法:
    index1     5.0
    index2     6.0
    index3     NaN
    index33    NaN
    index4     NaN
    index44    NaN
    dtype: float64
#除法:
    index1     1.5
    index2     2.0
    index3     NaN
    index33    NaN
    index4     NaN
    index44    NaN
    dtype: float64
1. 如何从csv文件只读取前几行的数据
# 只读取前2行和指定列的数据
df = pd.read_csv(‘https://raw.githubusercontent.com/selva86/datasets/master/Cars93_miss.csv‘,nrows=2,usecols=[‘Model‘,‘Length‘])
df

#>        Model    Length
    0    Integra    177
    1    Legend    195
2. 如何从csv文件中每隔n行来创建dataframe
# 每隔50行读取一行数据
df = pd.read_csv(‘https://raw.githubusercontent.com/selva86/datasets/master/BostonHousing.csv‘, chunksize=50)
df2 = pd.DataFrame()
for chunk in df:
    # 获取series
    df2 = df2.append(chunk.iloc[0,:])

#显示前5行
print(df2.head())

#>                      crim    zn  indus chas                  nox     rm   age  \
    0              0.21977   0.0   6.91    0  0.44799999999999995  5.602  62.0
    1               0.0686   0.0   2.89    0                0.445  7.416  62.5
    2   2.7339700000000002   0.0  19.58    0                0.871  5.597  94.9
    3               0.0315  95.0   1.47    0  0.40299999999999997  6.975  15.3
    4  0.19072999999999998  22.0   5.86    0                0.431  6.718  17.5

          dis rad  tax ptratio       b  lstat  medv
    0  6.0877   3  233    17.9   396.9   16.2  19.4
    1  3.4952   2  276    18.0   396.9   6.19  33.2
    2  1.5257   5  403    14.7  351.85  21.45  15.4
    3  7.6534   3  402    17.0   396.9   4.56  34.9
    4  7.8265   7  330    19.1  393.74   6.56  26.2
3. 如何改变导入csv文件的列值
改变列名‘medv’的值,当列值≤25时,赋值为‘Low’;列值>25时,赋值为‘High’.
# 使用converters参数,改变medv列的值
df = pd.read_csv(‘https://raw.githubusercontent.com/selva86/datasets/master/BostonHousing.csv‘,
                 converters={‘medv‘: lambda x: ‘High‘ if float(x) > 25 else ‘Low‘})
print(df.head())

#>            b  lstat  medv
    0  396.90   4.98   Low
    1  396.90   9.14   Low
    2  392.83   4.03  High
    3  394.63   2.94  High
    4  396.90   5.33  High
4. 如何从csv文件导入指定的列
# 导入指定的列:crim和medv
df = pd.read_csv(‘https://raw.githubusercontent.com/selva86/datasets/master/BostonHousing.csv‘, usecols=[‘crim‘, ‘medv‘])
# 打印前四行dataframe信息
print(df.head())

#>          crim  medv
    0  0.00632  24.0
    1  0.02731  21.6
    2  0.02729  34.7
    3  0.03237  33.4
    4  0.06905  36.2
5. 如何得到dataframe的行,列,每一列的类型和相应的描述统计信息
df = pd.read_csv(‘https://raw.githubusercontent.com/selva86/datasets/master/Cars93_miss.csv‘)

#  打印dataframe的行和列
print(df.shape)

# 打印dataframe每列元素的类型显示前5行
print(df.dtypes.head())

# 统计各类型的数目,方法1
print(df.get_dtype_counts())
# 统计各类型的数目,方法2
# print(df.dtypes.value_counts())

# 描述每列的统计信息,如std,四分位数等
df_stats = df.describe()
# dataframe转化数组
df_arr = df.values
#修改列名
df.rename(columns={0:‘price‘},inplace=True)
# 数组转化为列表
df_list = df.values.tolist()

#>    (93, 27)
    Manufacturer     object
    Model            object
    Type             object
    Min.Price       float64
    Price           float64
    dtype: object
    float64    18
    object      9
    dtype: int64
6. 如何获取给定条件的行和列
import numpy as np
df = pd.read_csv(‘https://raw.githubusercontent.com/selva86/datasets/master/Cars93_miss.csv‘)
# print(df)
# 获取最大值的行和列
row, col = np.where(df.values == np.max(df.Price))
# 行和列获取最大值
print(df.iat[row[0], col[0]])
df.iloc[row[0], col[0]]

# 行索引和列名获取最大值
df.at[row[0], ‘Price‘]
df.get_value(row[0], ‘Price‘)

#>    61.9
7. 如何重命名dataframe的特定列
df1 = pd.DataFrame(data=np.array([[18,50],[19,51],[20,55]]),index=[‘man1‘,‘man2‘,‘man3‘],columns=[‘age‘,‘weight‘])
print(df1)
# 修改列名
print("\nchange columns :\n")
#方法1
df1.rename(columns={‘weight‘:‘stress‘})
#方法2
df1.columns.values[1] = ‘stress‘
print(df1)

#>          age  weight
    man1   18      50
    man2   19      51
    man3   20      55

    change columns :

          age  stress
    man1   18      50
    man2   19      51
    man3   20      55
8. 如何检查dataframe中是否有缺失值
df = pd.read_csv(‘https://raw.githubusercontent.com/selva86/datasets/master/Cars93_miss.csv‘)

# 若有缺失值,则为Ture
df.isnull().values.any()

#>    True
9. 如何统计dataframe的每列中缺失值的个数
df = pd.read_csv(‘https://raw.githubusercontent.com/selva86/datasets/master/Cars93_miss.csv‘)

# 获取每列的缺失值个数
n_missings_each_col = df.apply(lambda x: x.isnull().sum())
print(n_missings_each_col.head())

#>    Manufacturer    4
    Model           1
    Type            3
    Min.Price       7
    Price           2
    dtype: int64
10. 如何用平均值替换相应列的缺失值
df = pd.read_csv(‘https://raw.githubusercontent.com/selva86/datasets/master/Cars93_miss.csv‘,nrows=10)
print(df[[‘Min.Price‘,‘Max.Price‘]].head())
# 平均值替换缺失值
df_out = df[[‘Min.Price‘, ‘Max.Price‘]] = df[[‘Min.Price‘, ‘Max.Price‘]].apply(lambda x: x.fillna(x.mean()))
print(df_out.head())

#>       Min.Price  Max.Price
    0       12.9       18.8
    1       29.2       38.7
    2       25.9       32.3
    3        NaN       44.6
    4        NaN        NaN

#>       Min.Price  Max.Price
    0       12.9       18.8
    1       29.2       38.7
    2       25.9       32.3
    3       23.0       44.6
    4       23.0       29.9
11. 如何用全局变量作为apply函数的附加参数处理指定的列
df = pd.read_csv(‘https://raw.githubusercontent.com/selva86/datasets/master/Cars93_miss.csv‘)
print(df[[‘Min.Price‘, ‘Max.Price‘]].head())
# 全局变量
d = {‘Min.Price‘: np.nanmean, ‘Max.Price‘: np.nanmedian}
# 列名Min.Price的缺失值用平均值代替,Max.Price的缺失值用中值代替
df[[‘Min.Price‘, ‘Max.Price‘]] = df[[‘Min.Price‘, ‘Max.Price‘]].apply(lambda x, d: x.fillna(d[x.name](x)), args=(d, ))
print(df[[‘Min.Price‘, ‘Max.Price‘]].head())

#>       Min.Price  Max.Price
    0       12.9       18.8
    1       29.2       38.7
    2       25.9       32.3
    3        NaN       44.6
    4        NaN        NaN
#>       Min.Price  Max.Price
    0  12.900000      18.80
    1  29.200000      38.70
    2  25.900000      32.30
    3  17.118605      44.60
    4  17.118605      19.15
12. 如何以dataframe的形式选择特定的列
df = pd.DataFrame(np.arange(20).reshape(-1, 5), columns=list(‘abcde‘))
# print(df)

# 以dataframe的形式选择特定的列
type(df[[‘a‘]])
type(df.loc[:, [‘a‘]])
print(type(df.iloc[:, [0]]))

# 以series的形式选择特定的列
type(df.a)
type(df[‘a‘])
type(df.loc[:, ‘a‘])
print(type(df.iloc[:, 1]))

#>    <class ‘pandas.core.frame.DataFrame‘>
    <class ‘pandas.core.series.Series‘>
13. 如何改变dataframe中的列顺序
df = pd.DataFrame(np.arange(20).reshape(-1, 5), columns=list(‘abcde‘))

print(df)
# 交换col1和col2
def switch_columns(df, col1=None, col2=None):
    colnames = df.columns.tolist()
    i1, i2 = colnames.index(col1), colnames.index(col2)
    colnames[i2], colnames[i1] = colnames[i1], colnames[i2]
    return df[colnames]

df1 = switch_columns(df, ‘a‘, ‘c‘)
print(df1)

#>        a   b   c   d   e
    0   0   1   2   3   4
    1   5   6   7   8   9
    2  10  11  12  13  14
    3  15  16  17  18  19
#>        c   b   a   d   e
    0   2   1   0   3   4
    1   7   6   5   8   9
    2  12  11  10  13  14
    3  17  16  15  18  19
原文:https://www.cnblogs.com/Melissa888/p/13214844.html