ElasticSearch 、Kibana、Filebeat、版本号 均为 7.7.0
官方下地址 https://www.elastic.co/cn/ 不推荐 在官网下载 速度太慢了,
建议使用国内 开源镜像地址下 如 华为开源镜像、阿里 等 ,本人在 华为开源镜像下载 https://mirrors.huaweicloud.com/。速度很给力,建议收藏该网址
基于Lucene的搜索服务器。它提供了一个分布式多用户能力的全文搜索引擎,基于RESTful web接口
解压zip包后 修改 config/elasticsearch.yml 文件
network.host: 127.0.0.1
http.port: 9200
在 cmd 中运行 bin/elasticsearch.bat
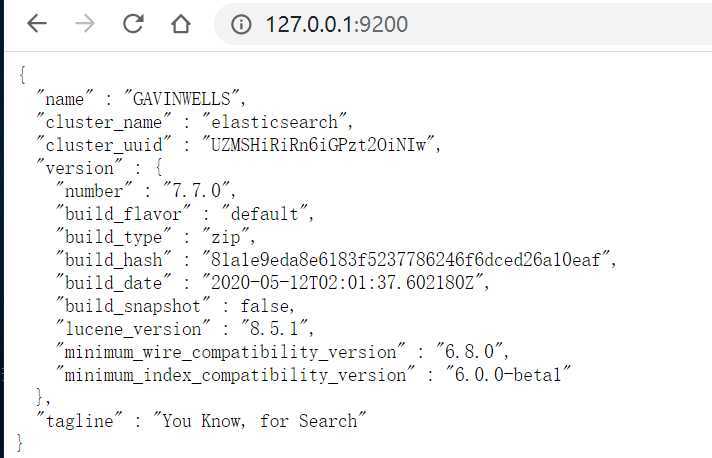
验证是否启动成功,
打开浏览器 访问 http://127.0.0.1:9200/ 如果 返回 json 字符,说明运行成功
解压zip包,修改 config/kibana.yml配置文件
# 配置IP 和端口号
server:
  port: 5601
  host: 127.0.0.1
# 配置 elasticsearch 地址
elasticsearch.hosts: ["http://127.0.0.1:9200"]
i18n.locale: "zh-CN"
在cmd中 运行 bin/kibana.bat
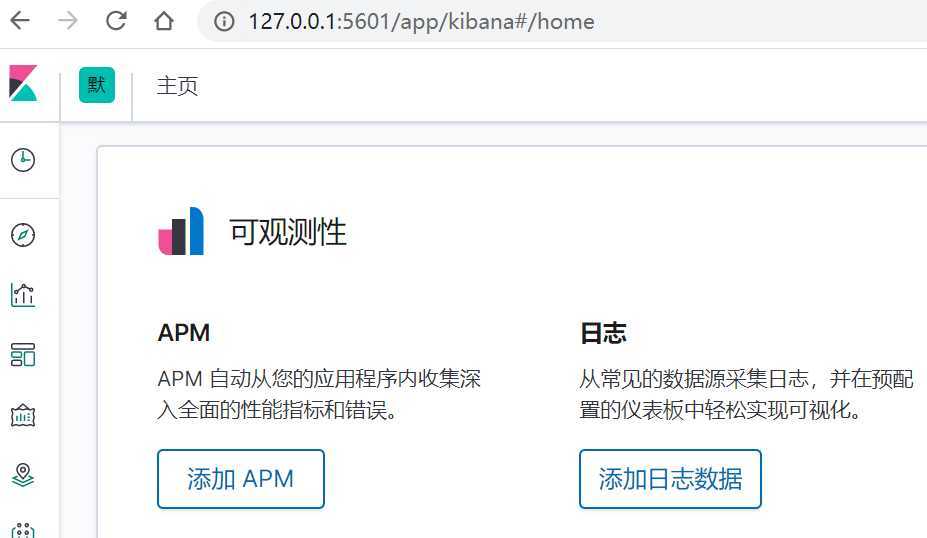
验证是否成功启动
打开浏览器 访问 http://127.0.0.1:5601/ 如果出现 kibana 可视化管理页面 ,说明成功启动
解压zip包,修改 filebeat.yml 配置文件
# 输入
filebeat.inputs:
# Each - is an input. Most options can be set at the input level, so
# you can use different inputs for various configurations.
# Below are the input specific configurations.
# 需要采集日志的地方
- type: log
  # Change to true to enable this input configuration.
  enabled: true
  #发送文件 编码  utf-8 解决中文日志乱码问题
  encoding: utf-8
  # Paths that should be crawled and fetched. Glob based paths.
  #需要收集的日志地址
  paths:
    - D:/log/*.log
    - D:/log2/*.log

name: myFileBeatTest

setup.kibana:
  host: "127.0.0.1:5601"

output.elasticsearch:
  hosts: ["127.0.0.1:9200"]
monitoring.enabled: true
修改 modules.d/elasticsearch.yml.enable , modules.d/logstash.yml.enable
在cmd 中 输入 filebeat.exe setup -e ,回车启动 filebeat
http://127.0.0.1:5601/app/kibana#/home
建立kibana索引、elasticseart索引
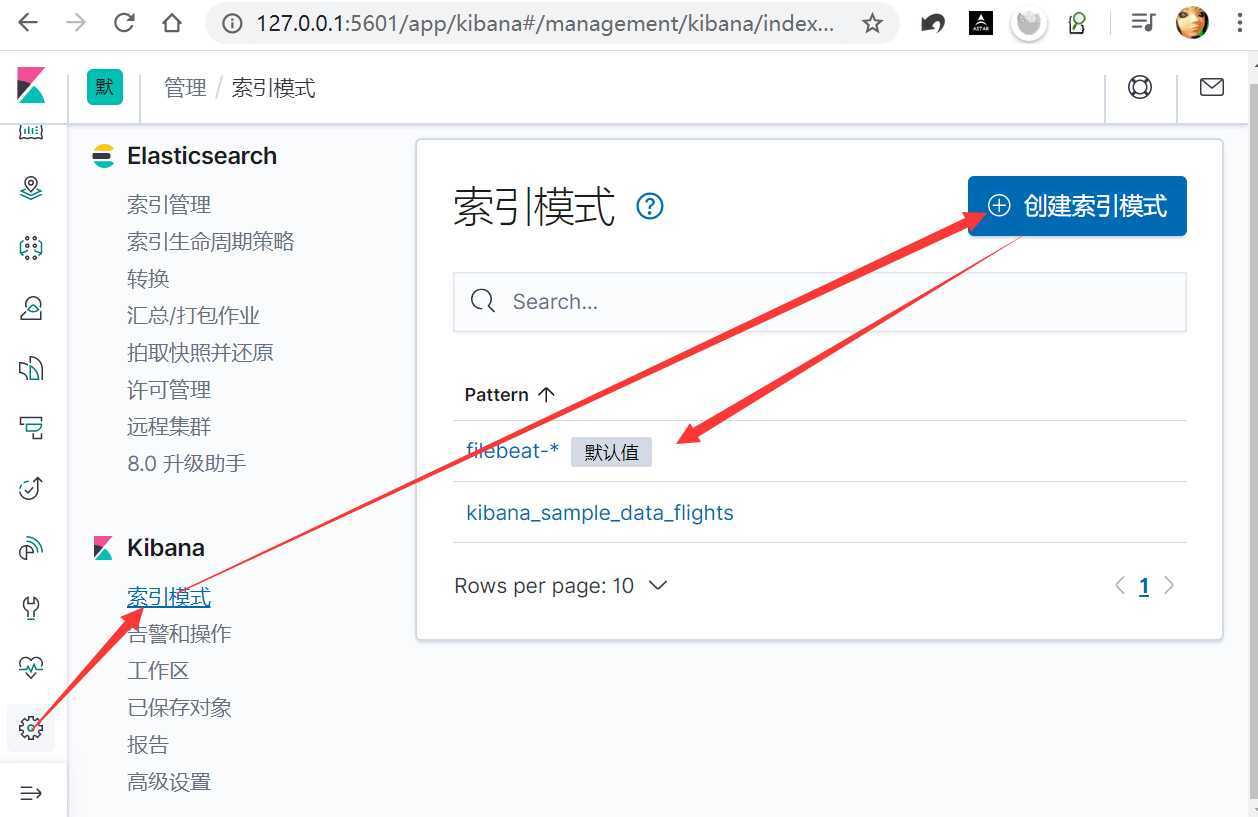
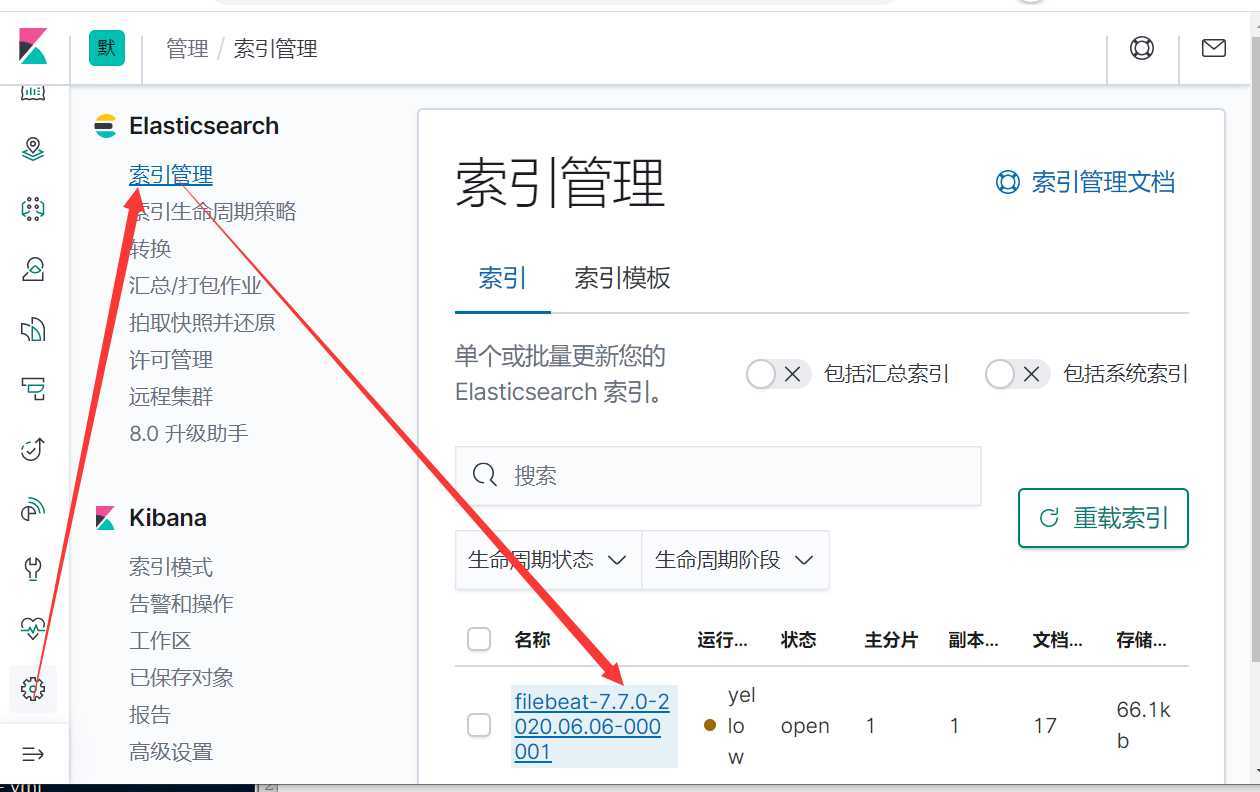
添加筛选字段、通过仪表盘查看收集到的日志数据
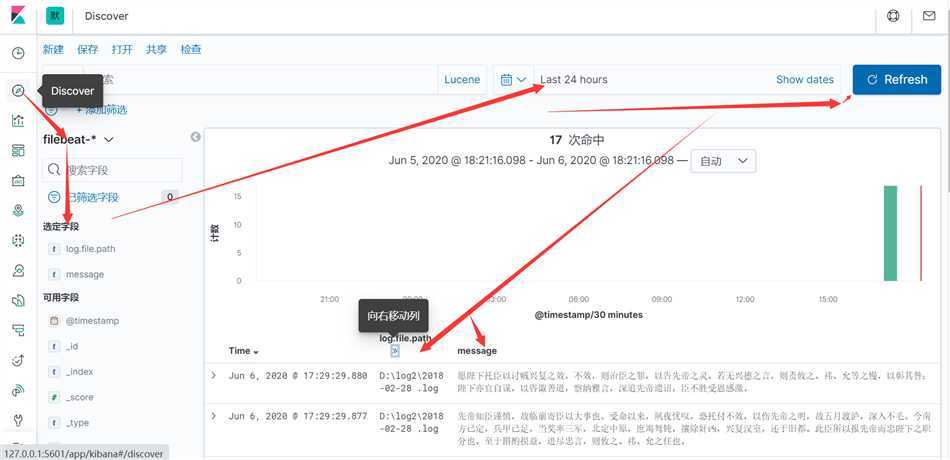
本人在搭建过程遇到最大问题其实是不知道如何使用 kibana, 添加日志文件 建立索引和查看数据(如果有能力的情况下看官网文档)
到此你已经完成 了 日志收集 和 日志数据查看 查看 的简单 dmeo了
在linux 部署其实步骤 一样,只不过启动 linux 启动命令 不太一样,请自行学习 ,主要的是 配置文件的参数 修改 ,和 kibana 可视化工具的使用,建立索引,查看日志。
如需高级 文件 日志 过滤,指定 数据收集,请参考 filebeat 配置文件 参数详解,或 使用 logstash 工具 来实现。
ELKF-分布式日志收集平台搭建 最小化 配置过程 - 查看收集日志(windows10下搭建)
原文:https://www.cnblogs.com/geekswg/p/13055954.html