中国五城市六年pm2.5大数据可视化
一,典型课题研究
中国五城市六年的pm2.5的值与那些因素有关,与PM2.5的变化
二,数据
1,数据源:https://www.kaggle.com/uciml/pm25-data-for-five-chinese-cities
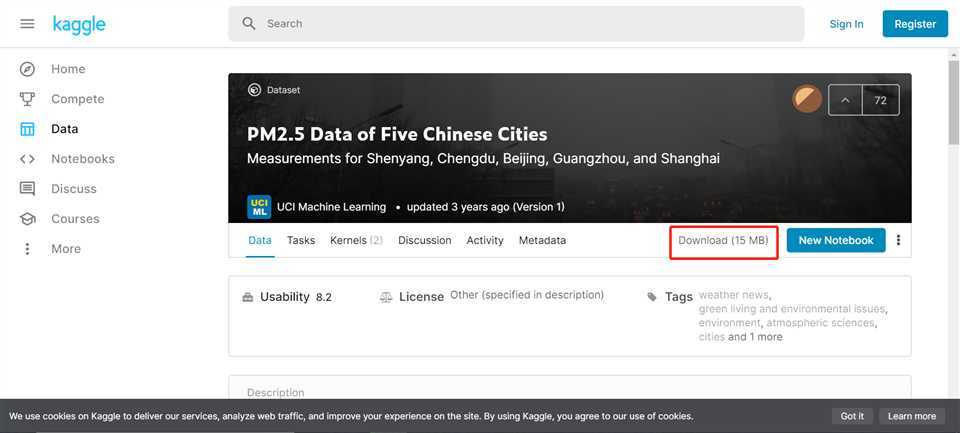
2,数据集介绍
Context
PM2.5 readings are often included in air quality reports from environmental authorities and companies. PM2.5 refers to atmospheric particulate matter (PM) that have a diameter less than 2.5 micrometers. In other words, it‘s used as a measure of pollution.
PM2.5读数通常包含在环境部门和公司的空气质量报告中。PM2.5是指直径小于2.5微米的大气颗粒物(PM)。换句话说,它被用作污染的量度。
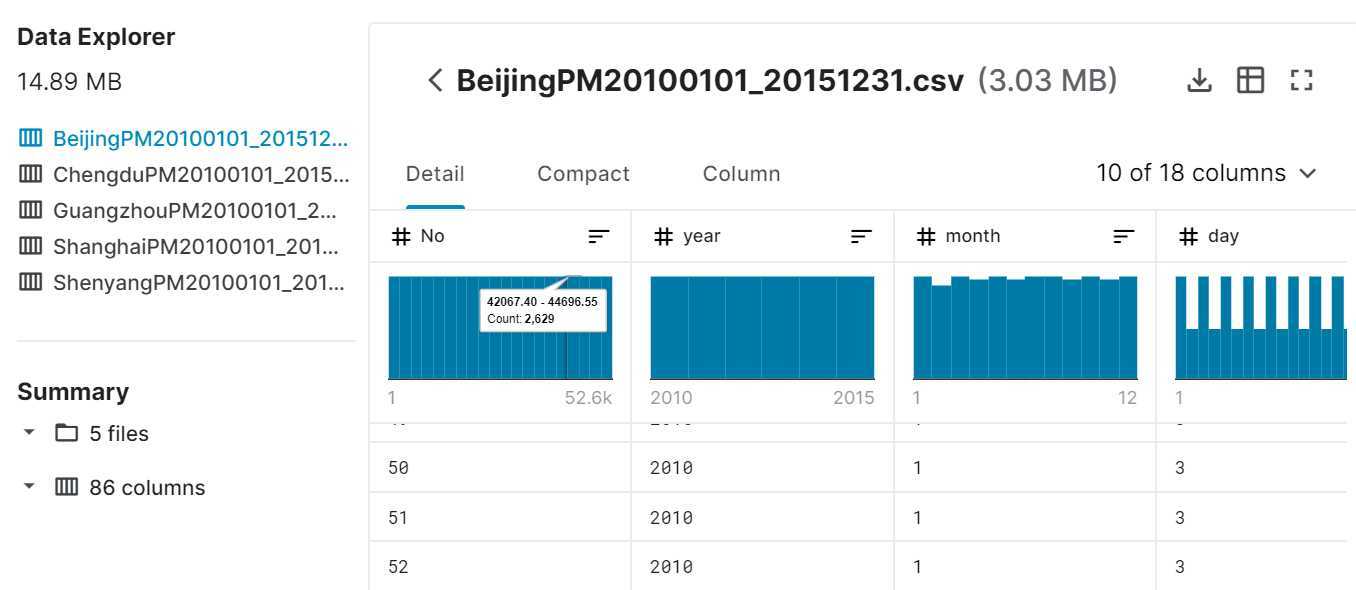
3,字段含义
- No: row number 行号
- year: year of data in this row 该行中数据的年份
- month: month of data in this row 该行中数据的月份
- day: day of data in this row 该行中数据的日期
- hour: hour of data in this row 该行中的小时数据
- season: season of data in this row 此行中的数据季节
- PM: PM2.5 concentration (ug/m^3) PM2.5浓度(ug / m ^ 3)
- DEWP: Dew Point (Celsius Degree) 露点(摄氏温度)
- TEMP: Temperature (Celsius Degree) 温度(摄氏温度)
- HUMI: Humidity (%) 湿度(%)
- PRES: Pressure (hPa) 压力(hPa)
- cbwd: Combined wind direction 组合风向
- Iws: Cumulated wind speed (m/s) 累积风速(m / s)
- precipitation: hourly precipitation (mm) 每小时降水量(毫米)
- Iprec: Cumulated precipitation (mm) 累积降水量(毫米)
tableau项目实战-中国五城市六年pm2.5大数据可视化
原文:https://www.cnblogs.com/bigbigbird/p/12885893.html