转载自:
http://www.cnblogs.com/darkknightzh/p/6117528.html
参考网址:
http://stackoverflow.com/questions/22408237/named-colors-in-matplotlib
http://stackoverflow.com/questions/8409095/matplotlib-set-markers-for-individual-points-on-a-line
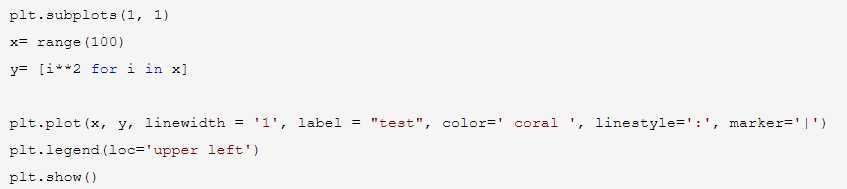
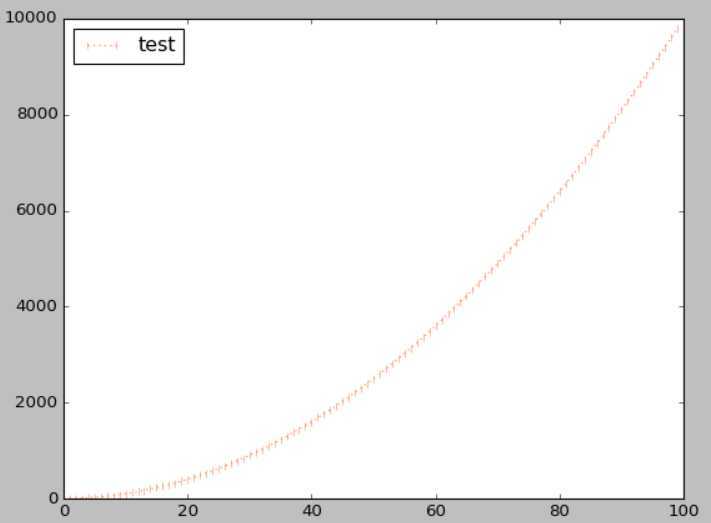
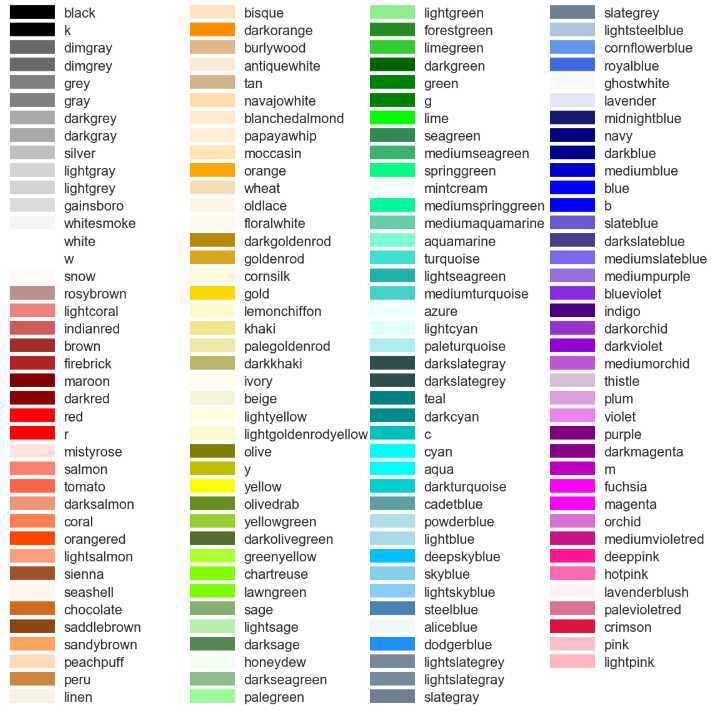
说明:其实上面color=‘ coral ‘中,可以换成color=‘ #054E9F‘,每两个十六进制数分别代表R、G、B分量:
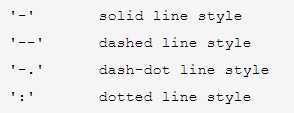
第二个参考网址给出了linestyle可选参数:
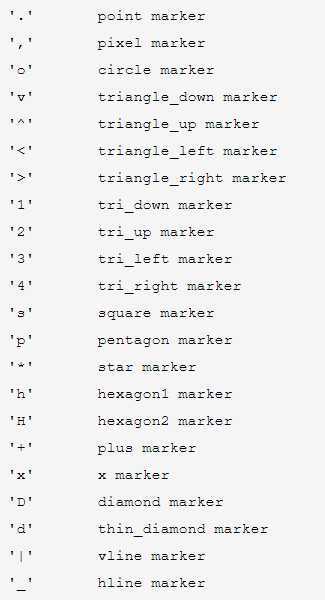
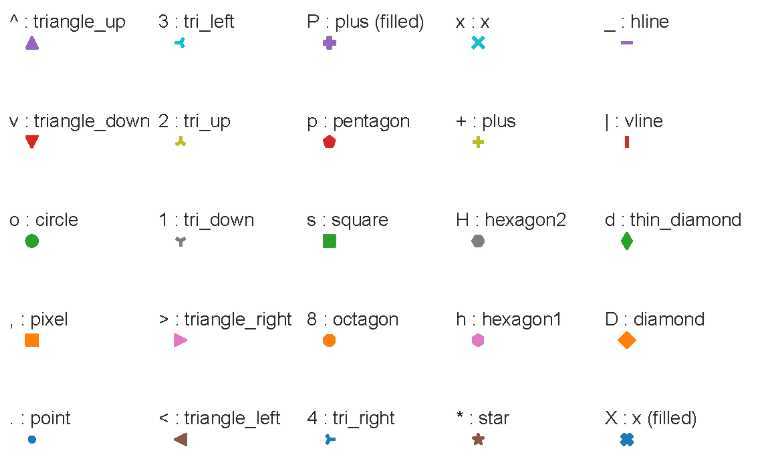
第二个参考网址给出了marker可选参数:
第一个参考网址给出了matplotlib中color可用的颜色:
原文:https://www.cnblogs.com/wangconnor/p/12827524.html