一、主题式网络爬虫设计方案
1.主题式网络爬虫名称:爬取百度热搜
2.主题式网络爬虫爬取的内容与数据特征分析:百度热搜排行,标题,热度
3.主题式网络爬虫设计方案概述:先搜索网站,查找数据并比对然后再输入代码进行爬取。难点在于文件的生成和读取。
二、主题页面的结构特征分析
1.主题页面的结构与特征分析
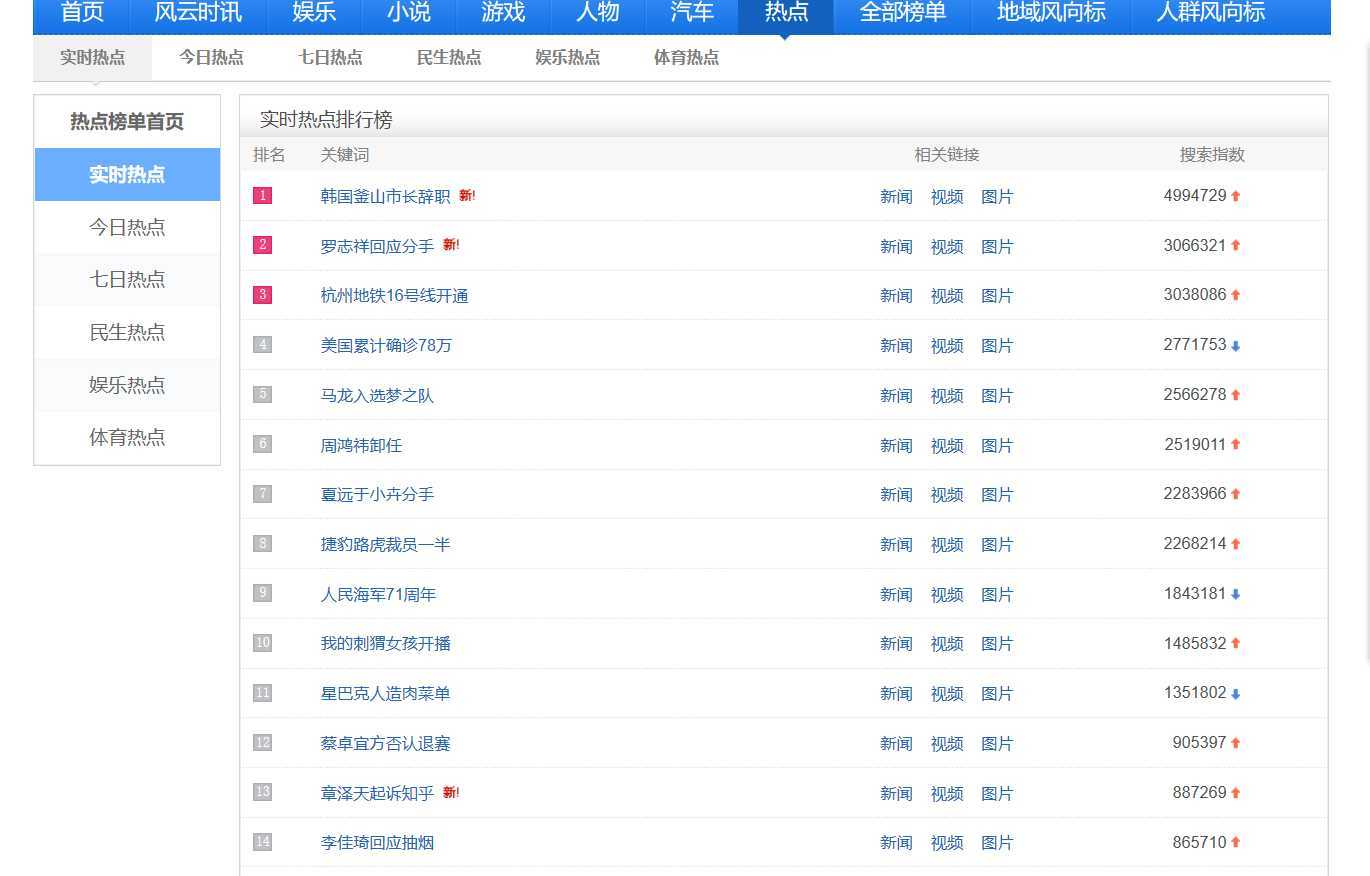
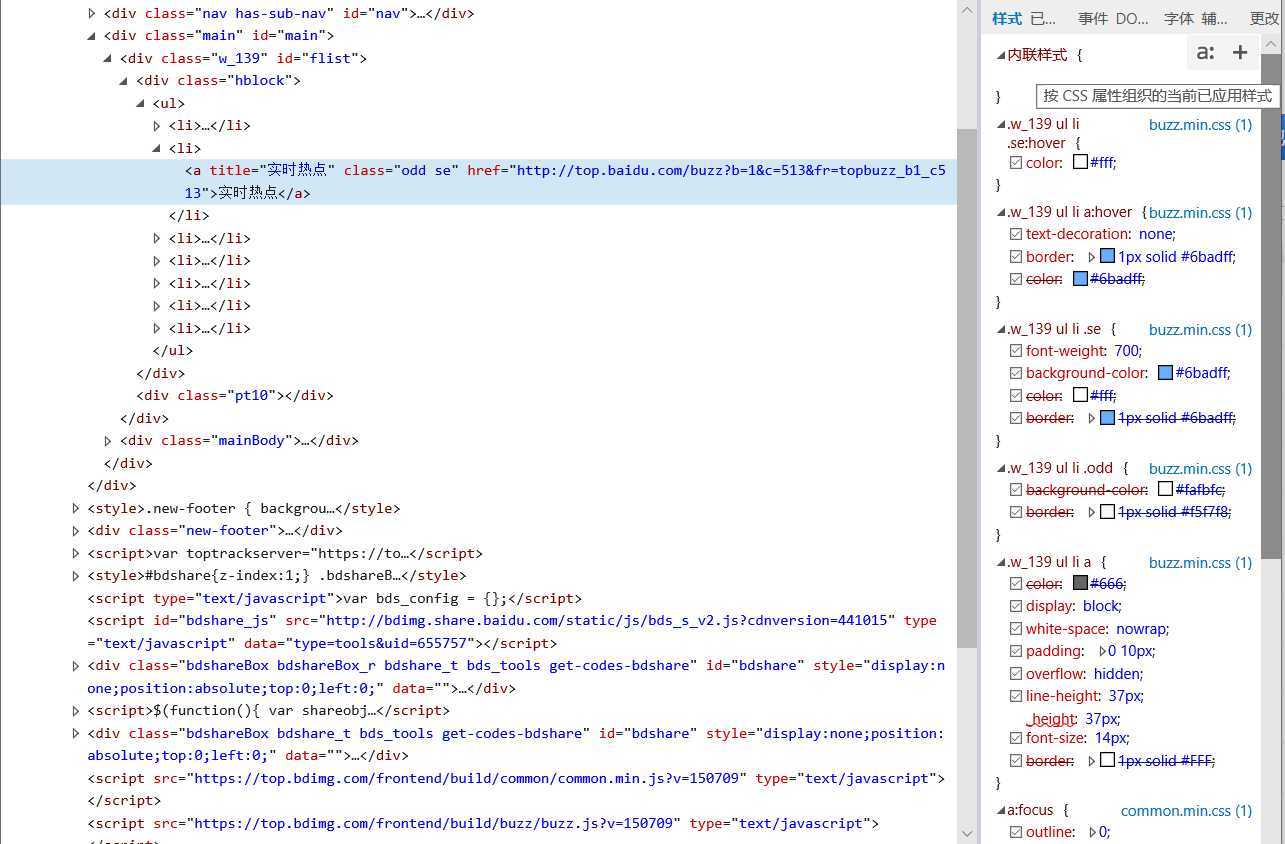
2.Htmls页面解析
三、网络爬虫程序设计
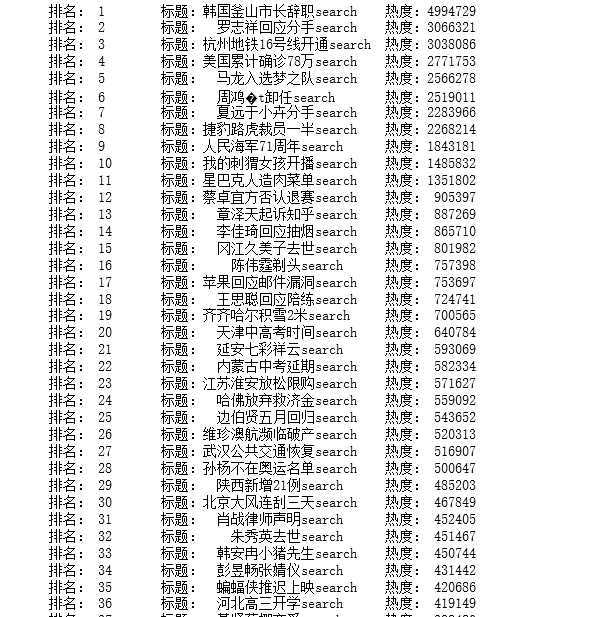
1.数据爬取与采集
import requests

from bs4 import BeautifulSoup


def get_html(url,headers):

   r = requests.get(url,headers=headers)

   r.encoding = r.apparent_encoding

   return r.text


def get_pages(html):

   soup = BeautifulSoup(html,‘html.parser‘)

   all_topics=soup.find_all(‘tr‘)[1:]

   for each_topic in all_topics:

       topic_times = each_topic.find(‘td‘, class_=‘last‘)  # 搜索指数

       topic_rank = each_topic.find(‘td‘, class_=‘first‘)  # 排名

       topic_name = each_topic.find(‘td‘, class_=‘keyword‘)  # 标题目

       if topic_rank != None and topic_name != None and topic_times != None:

           topic_rank = each_topic.find(‘td‘, class_=‘first‘).get_text().replace(‘ ‘, ‘‘).replace(‘\n‘, ‘‘)

           topic_name = each_topic.find(‘td‘, class_=‘keyword‘).get_text().replace(‘ ‘, ‘‘).replace(‘\n‘, ‘‘)

           topic_times = each_topic.find(‘td‘, class_=‘last‘).get_text().replace(‘ ‘, ‘‘).replace(‘\n‘, ‘‘)

           # print(‘排名:{},标题:{},热度:{}‘.format(topic_rank,topic_name,topic_times))

           tplt = "排名:{0:^4}\t标题:{1:{3}^15}\t热度:{2:^8}"

           print(tplt.format(topic_rank, topic_name, topic_times, chr(12288)))


def main():

    #百度热点排行榜单链接

    url = ‘http://top.baidu.com/buzz?b=1&fr=20811‘

    headers = {‘User-Agent‘: ‘Mozilla/5.0‘}

    html = get_html(url, headers)

    get_pages(html)


if __name__ == ‘__main__‘:

    main()
2.对数据进行清洗和处理
读取文件
import pandas as pd
#读取文件
df=pd.DataFrame(pd.read_csv(‘mmm.csv‘))
print(df)
#删除无效列与行
df.drop(‘标题‘, axis=1, inplace = True)
df.head()
3.数据分析与可视化
#绘制垂直柱状图
plt.bar([‘第1名‘,‘第2名‘,‘第3名‘,‘第4名‘,‘第5名‘],[5953262,2775714,2443604,2313987,2209700],label="百度热搜前五名")
#绘制水平柱状图
plt.barh([‘第1名‘,‘第2名‘,‘第3名‘,‘第4名‘,‘第5名‘],[5953262,2775714,2443604,2313987,2209700],label="百度热搜前五名")
#绘制折线图
def two():
x = df[‘排名‘]
y = df[‘热搜指数‘]
plt.xlabel(‘排名‘)
plt.ylabel(‘热度指数‘)
plt.plot(x,y)
plt.scatter(x,y)
plt.title("绘制折线图")
plt.show()
two()
#绘制散点图
def sandian():
x = df[‘排名‘]
y = df[‘热搜指数‘]
plt.xlabel(‘排名‘)
plt.ylabel(‘热搜指数‘)
plt.scatter(x,y,color="red",label=u"热度分布数据",linewidth=2)
plt.title("排名与热搜指数散点图")
plt.legend()
plt.show()
sandian()
4.将以上各部分的代码汇总
import requests

from bs4 import BeautifulSoup


def get_html(url,headers):

   r = requests.get(url,headers=headers)

   r.encoding = r.apparent_encoding

   return r.text


def get_pages(html):

   soup = BeautifulSoup(html,‘html.parser‘)

   all_topics=soup.find_all(‘tr‘)[1:]

   for each_topic in all_topics:

       topic_times = each_topic.find(‘td‘, class_=‘last‘)  # 搜索指数

       topic_rank = each_topic.find(‘td‘, class_=‘first‘)  # 排名

       topic_name = each_topic.find(‘td‘, class_=‘keyword‘)  # 标题目

       if topic_rank != None and topic_name != None and topic_times != None:

           topic_rank = each_topic.find(‘td‘, class_=‘first‘).get_text().replace(‘ ‘, ‘‘).replace(‘\n‘, ‘‘)

           topic_name = each_topic.find(‘td‘, class_=‘keyword‘).get_text().replace(‘ ‘, ‘‘).replace(‘\n‘, ‘‘)

           topic_times = each_topic.find(‘td‘, class_=‘last‘).get_text().replace(‘ ‘, ‘‘).replace(‘\n‘, ‘‘)

           # print(‘排名:{},标题:{},热度:{}‘.format(topic_rank,topic_name,topic_times))

           tplt = "排名:{0:^4}\t标题:{1:{3}^15}\t热度:{2:^8}"

           print(tplt.format(topic_rank, topic_name, topic_times, chr(12288)))


def main():

    #百度热点排行榜单链接

    url = ‘http://top.baidu.com/buzz?b=1&fr=20811‘

    headers = {‘User-Agent‘: ‘Mozilla/5.0‘}

    html = get_html(url, headers)

    get_pages(html)


if __name__ == ‘__main__‘:

    main()
import pandas as pd
#读取文件
df=pd.DataFrame(pd.read_csv(‘mmm.csv‘))
print(df)
#删除无效列与行
df.drop(‘标题‘, axis=1, inplace = True)
df.head()
#绘制垂直柱状图
plt.bar([‘第1名‘,‘第2名‘,‘第3名‘,‘第4名‘,‘第5名‘],[5953262,2775714,2443604,2313987,2209700],label="百度热搜前五名")
#绘制水平柱状图
plt.barh([‘第1名‘,‘第2名‘,‘第3名‘,‘第4名‘,‘第5名‘],[5953262,2775714,2443604,2313987,2209700],label="百度热搜前五名")
#绘制折线图
def two():
    x = df[‘排名‘]
    y = df[‘热搜指数‘]
    plt.xlabel(‘排名‘)
    plt.ylabel(‘热度指数‘)
    plt.plot(x,y)
    plt.scatter(x,y)
    plt.title("绘制折线图")
    plt.show()
two()

#绘制散点图
def sandian():
x = df[‘排名‘]
y = df[‘热搜指数‘]
plt.xlabel(‘排名‘)
plt.ylabel(‘热搜指数‘)
plt.scatter(x,y,color="red",label=u"热度分布数据",linewidth=2)
plt.title("排名与热搜指数散点图")
plt.legend()
plt.show()
sandian()
四、结论
1.所得结论:热度越高排名越靠前。
2.小结:通过这次做题让我发现了自己在学习Python这方面的能力有待提高,学好Python对我来说是一项挑战。在此次任务中我找了资料和观看视频,但是还是没有很好的做好任务,学习能力有待提高,希望改善学习方法,争取学好Python。
原文:https://www.cnblogs.com/nature1/p/12764961.html