一、主题式网络爬虫设计方案
1.主题式网络爬虫名称:爬取百度热榜与数据处理
2.爬取内容:百度前十,搜索指数
3.难点:如何爬取和函数的应用
二、主题页面的结构特征分析
分析网页

得到url为http://top.baidu.com/buzz?b=341&fr=topindex
3.节点查找方法
js = json.loads(html)
# 定位到albumTime和albumCount
albumlist = js[‘data‘][‘album‘][‘list‘]
for song in albumlist:
    albumtime = song[‘publicTime‘]
    albumsongs = song[‘song_count‘]
    #判断,将符合条件的值加入value中。
    if eval(albumtime.split(‘-‘)[0]) in all_albumcount:
        temp = eval(albumtime.split(‘-‘)[0])
        all_albumcount[temp] += eval(str(albumsongs))
三、网络爬虫程序设计
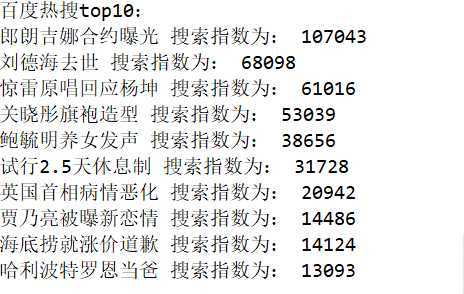
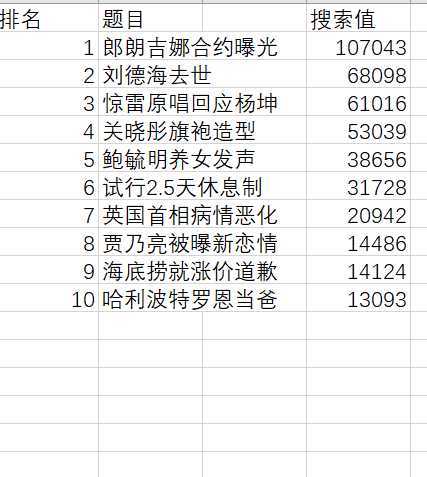
import requests
from lxml import etree

head = {}
url = "http://top.baidu.com/buzz?b=341&fr=topindex"
head["User-Agent"] = "Mozilla/5.0 (Windows NT 10.0; WOW64; rv:63.0) Gecko/20100101 Firefox/63.0"
head["Accept"]= "text/html,application/xhtml+xml,application/xml;q=0.9,*/*;q=0.8"
head["Accept-Language"]= "zh-CN,zh;q=0.8,zh-TW;q=0.7,zh-HK;q=0.5,en-US;q=0.3,en;q=0.2"
head["Connection"] = "keep-alive"
def main():
    print("百度热搜top10: ")
    res = requests.get(url , headers = head)
    with open("html.txt", "wb") as f:
        f.write(res.content)
    html = etree.parse(‘html.txt‘ , etree.HTMLParser(encoding=‘gbk‘))
    top_list = html.xpath(‘//a[@class="list-title"]/text()‘)
    num_search = html.xpath(‘//span[@class="icon-rise"]/text()‘)


    for i  , j in zip(top_list[:10] , num_search[:10]):
        print(i ,"搜索指数为:" ,  j  )
if __name__ == ‘__main__‘:
    main()
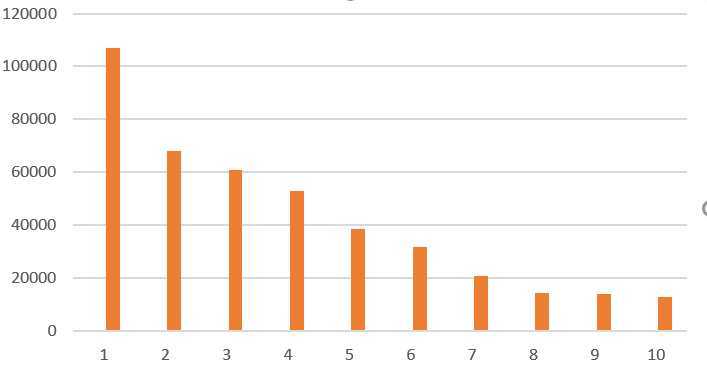
直方图
def ChartBar(xaxis, yaxis):
    plt.figure()
    plt.bar(left=xaxis, height=yaxis, color=‘b‘, width=0.5)
    plt.ylabel(‘top_list‘)
    plt.xlabel(‘num_search‘)
    plt.title(‘Barplot‘)
    # 保存程序结果,数据持久化
    plt.savefig(‘Bar‘, dpi=600)
    print(‘条形图保存成功‘)
    plt.show()
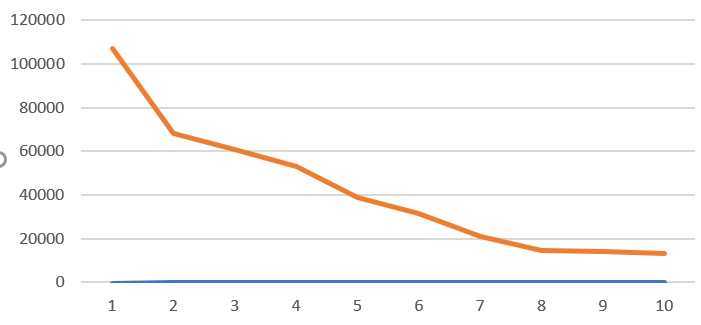
折线图
def ChartBroken(x, y):
     #图片在额外的窗口显示
     plt.figure()
     plt.plot(x, y)
     #y轴命名
     plt.ylabel(‘num_search‘)
     #x轴命名
     plt.xlabel(‘top_list‘)
     plt.axis([0, 120000, 0, 20000])
     plt.title(‘Brokenplot‘)
     # 保存程序结果,数据持久化
     plt.savefig(‘Broken‘, dpi=600)
     print(‘折线图保存成功‘)
     plt.show()
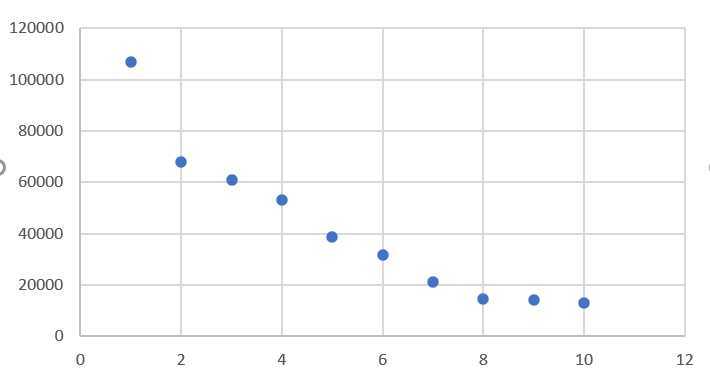
散点图
def sandian():
x = df[‘排名‘]
y = df[‘热度‘]
plt.xlabel(‘排名‘)
plt.ylabel(‘热度‘)
plt.scatter(x,y,color="red",label=u"热度分布数据",linewidth=2)
plt.title("排名与热度散点图")
plt.legend()
plt.show()
sandian()
代码汇总
import requests
from lxml import etree
head = {}
url = "http://top.baidu.com/buzz?b=341&fr=topindex"
head["User-Agent"] = "Mozilla/5.0 (Windows NT 10.0; WOW64; rv:63.0) Gecko/20100101 Firefox/63.0"
head["Accept"]= "text/html,application/xhtml+xml,application/xml;q=0.9,*/*;q=0.8"
head["Accept-Language"]= "zh-CN,zh;q=0.8,zh-TW;q=0.7,zh-HK;q=0.5,en-US;q=0.3,en;q=0.2"
head["Connection"] = "keep-alive"
def main():
    print("百度热搜top10: ")
    res = requests.get(url , headers = head)
    with open("html.txt", "wb") as f:
        f.write(res.content)
    html = etree.parse(‘html.txt‘ , etree.HTMLParser(encoding=‘gbk‘))
    top_list = html.xpath(‘//a[@class="list-title"]/text()‘)
    num_search = html.xpath(‘//span[@class="icon-rise"]/text()‘)
    for i  , j in zip(top_list[:10] , num_search[:10]):
        print(i ,"搜索指数为:" ,  j  )
if __name__ == ‘__main__‘:
    main()
js = json.loads(html)
# 定位到albumTime和albumCount
albumlist = js[‘data‘][‘album‘][‘list‘]
for song in albumlist:
    albumtime = song[‘publicTime‘]
    albumsongs = song[‘song_count‘]
    #判断,将符合条件的值加入value中。
    if eval(albumtime.split(‘-‘)[0]) in all_albumcount:
        temp = eval(albumtime.split(‘-‘)[0])
        all_albumcount[temp] += eval(str(albumsongs))
def ChartBar(xaxis, yaxis):
    plt.figure()
    plt.bar(left=xaxis, height=yaxis, color=‘b‘, width=0.5)
    plt.ylabel(‘top_list‘)
    plt.xlabel(‘num_search‘)
    plt.title(‘Barplot‘)
    # 保存程序结果,数据持久化
    plt.savefig(‘Bar‘, dpi=600)
    print(‘条形图保存成功‘)
    plt.show()
def ChartBroken(x, y):
     #图片在额外的窗口显示
     plt.figure()
     plt.plot(x, y)
     #y轴命名
     plt.ylabel(‘num_search‘)
     #x轴命名
     plt.xlabel(‘top_list‘)
     plt.axis([0, 120000, 0, 20000])
     plt.title(‘Brokenplot‘)
     # 保存程序结果,数据持久化
     plt.savefig(‘Broken‘, dpi=600)
     print(‘折线图保存成功‘)
     plt.show()
def sandian():
x = df[‘排名‘]
y = df[‘热度‘]
plt.xlabel(‘排名‘)
plt.ylabel(‘热度‘)
plt.scatter(x,y,color="red",label=u"热度分布数据",linewidth=2)
plt.title("排名与热度散点图")
plt.legend()
plt.show()
sandian()
四.结论
1.根据图形表明,热度是随着排名的递增而递增的。排名越高,热度越高
2.在这次对百度热榜的分析的过程中,我学习到了很多函数的用法,也碰到了很多难题,但最后都依靠观看视频和请教别人解决。提高了我对Python的兴趣
原文:https://www.cnblogs.com/aaac/p/12727166.html