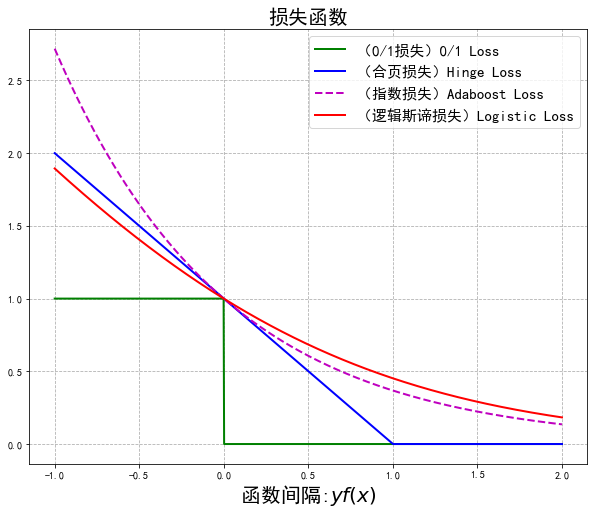
import numpy as np
import math
import matplotlib.pyplot as plt
plt.rcParams[‘font.sans-serif‘] = [‘SimHei‘]
plt.rcParams[‘axes.unicode_minus‘] = False
plt.figure(figsize=(10,8))
x = np.linspace(start=-1, stop=2, num=1001, dtype=np.float)
logi = np.log(1 + np.exp(-x)) / math.log(2)
boost = np.exp(-x)
y_01 = x < 0
y_hinge = 1.0 - x
y_hinge[y_hinge < 0] = 0

plt.plot(x, y_01, ‘g-‘, mec=‘k‘, label=‘(0/1损失)0/1 Loss‘, lw=2)
plt.plot(x, y_hinge, ‘b-‘, mec=‘k‘, label=‘(合页损失)Hinge Loss‘, lw=2)
plt.plot(x, boost, ‘m--‘, mec=‘k‘, label=‘(指数损失)Adaboost Loss‘, lw=2)
plt.plot(x, logi, ‘r-‘, mec=‘k‘, label=‘(逻辑斯谛损失)Logistic Loss‘, lw=2)
plt.grid(True, ls=‘--‘)
plt.legend(loc=‘upper right‘,fontsize=15)
plt.xlabel(‘函数间隔:$yf(x)$‘,fontsize=20)
plt.title(‘损失函数‘,fontsize=20)
plt.show()
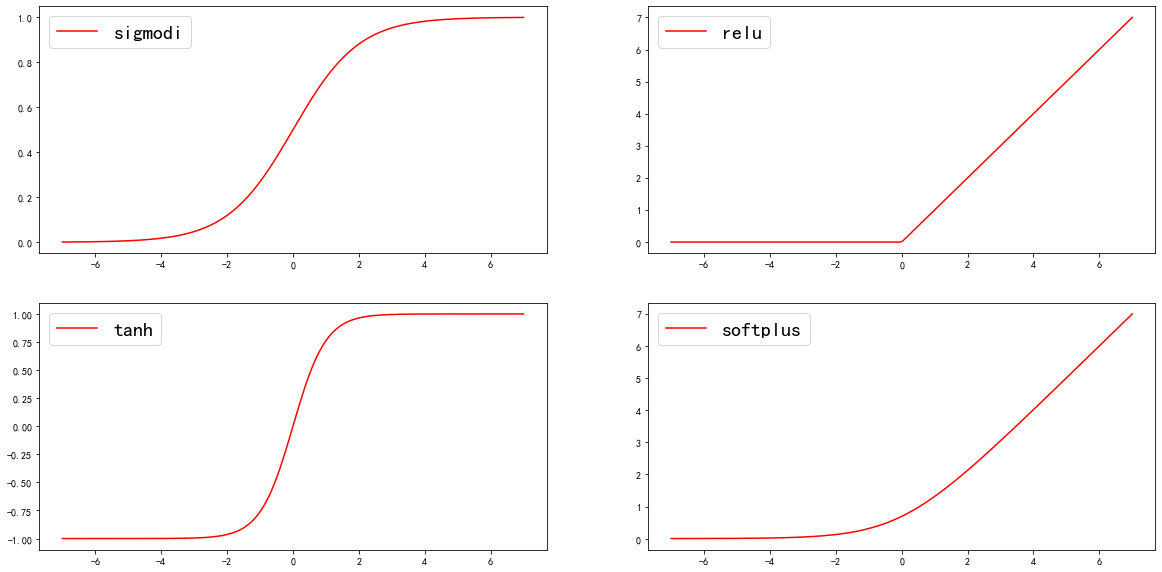
import numpy as np
import matplotlib.pyplot as plt

#创建输入数据
x = np.linspace(-7,7,180)
#激活函数的原始实现
def sigmoid(inputs):
    y = [1/float(1+np.exp(-x)) for x in inputs]
    return y
def relu(inputs):
    y = [x*(x>0) for x in inputs]
    return y
def tanh(inputs):
    y = [(np.exp(x)-np.exp(-x))/float(np.exp(x)+np.exp(-x)) for x in inputs]
    return y
def softplus(inputs):
    y = [np.log(1+np.exp(x)) for x in inputs]
    return y

y_sigmoid = sigmoid(x)
y_relu = relu(x)
y_tanh = tanh(x)
y_softplus = softplus(x)

fig = plt.figure(figsize=(20,10))
#创建各个图像
plt.subplot(221)
plt.plot(x,y_sigmoid,c=‘r‘,label=‘sigmodi‘)
plt.legend(loc=‘best‘,fontsize=20)

plt.subplot(222)
plt.plot(x,y_relu,c=‘r‘,label=‘relu‘)
plt.legend(loc=‘best‘,fontsize=20)

plt.subplot(223)
plt.plot(x,y_tanh,c=‘r‘,label=‘tanh‘)
plt.legend(loc=‘best‘,fontsize=20)

plt.subplot(224)
plt.plot(x,y_softplus,c=‘r‘,label=‘softplus‘)
plt.legend(loc=‘best‘,fontsize=20)
plt.show()
原文:https://www.cnblogs.com/yukizzc/p/12720610.html