prometheus 的下载地址
https://prometheus.io/download/#prometheus
下载完之后,解压,拷贝到/usr/local
[root@server04 down]# tar -xvzf prometheus-2.2.0-rc.0.linuxamd64.tar.gz
cp -r prometheus-2.2.0-rc.0.linux-amd64 /usr/local/

./promehteus #直接运行
使?daemonize 放?后台?式, daemonize Unix系统后台守护进程管理软件
需要先下载安装daemonize
git clone https://github.com/bmc/daemonize.git sh?configure &&?make &&?sudo?make?install
用daemonize去启动prometheus服务

daemonize -c /data/prometheus/ /data/prometheus/up.sh
运行完上面的命令之后,会在/data/prometheus/ 这个目录下产生一个data的目录,下次重启需要指定这个目录
-c 是指定运?路径 /data/prometheus/up.sh 是运?路径下的 ?个启动脚本
脚本内容如下:
需要把解压之后的prometheus放到/data/prometheus目录下面
/data/prometheus/prometheus/prometheus --config.file="/data/prometheus/prometheus/prometheus.yml"
[root@k8s-node1 prometheus]# grep -v "^#" /data/prometheus/prometheus/prometheus.yml
global:
  scrape_interval:     15s # Set the scrape interval to every 15 seconds. Default is every 1 minute.
  evaluation_interval: 15s # Evaluate rules every 15 seconds. The default is every 1 minute.
  # scrape_timeout is set to the global default (10s).

alerting:
  alertmanagers:
  - static_configs:
    - targets:
      # - alertmanager:9093

rule_files:
  # - "first_rules.yml"
  # - "second_rules.yml"

scrape_configs:
  # The job name is added as a label `job=<job_name>` to any timeseries scraped from this config.
  - job_name: ‘prometheus‘

    # metrics_path defaults to ‘/metrics‘
    # scheme defaults to ‘http‘.

    static_configs:
    - targets: [‘localhost:9090‘]
?个就是 全局变量 scrape_interval 设置多少时间间隔 采集? 次数据
另?个 就是 job和targets的写法 配置?个job的标签,然后 在 这个标签下 定义 我们需要监控的机器
4.1 客户端配置
下载地址为 https://prometheus.io/download/#node_exporter
默认运?在 9100端口
启动:
daemonize -c /data/node_exporter/ /data/node_exporter/up.sh
脚本内容:
cat up.sh
/prometheus/node_exporter/node_exporter --web.listen-address=":9200"
查询数据:
curl localhost:9100/metrics
● 监控服务器更改配置文件:如下 9200是node_export的默认端口号

然后去网页查看,点Status --》点Targets --》
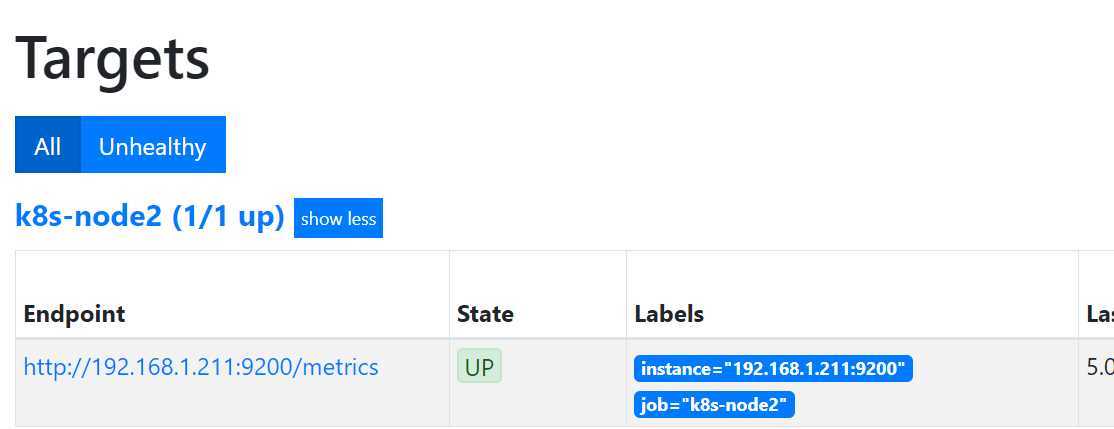
其中1.211是按照pushgatway的服务器
然后重启prometheus服务器即可
下载地址 https://prometheus.io/download/#pushgateway 解压后 直接运?
默认端口是9091
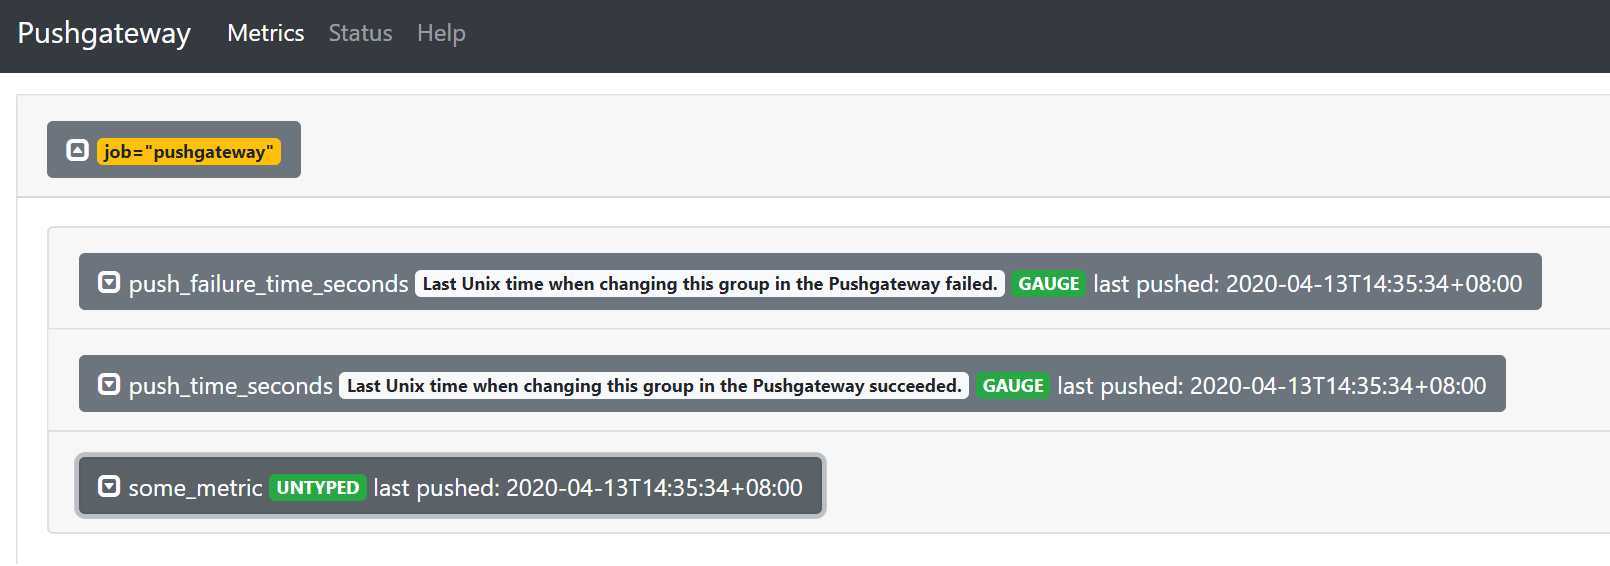
启动完成之后,可以访问 http://192.168.1.211:9091/#
编写监控脚本,用来收集等待连接数
#!/bin/bash
instance_name=`hostname -f | cut -d‘.‘ -f1` #本机机器名变量用于之后的标签
if [ $instance_name == "localhost" ];then
echo "Must FQDN hostname"
exit 1
fi
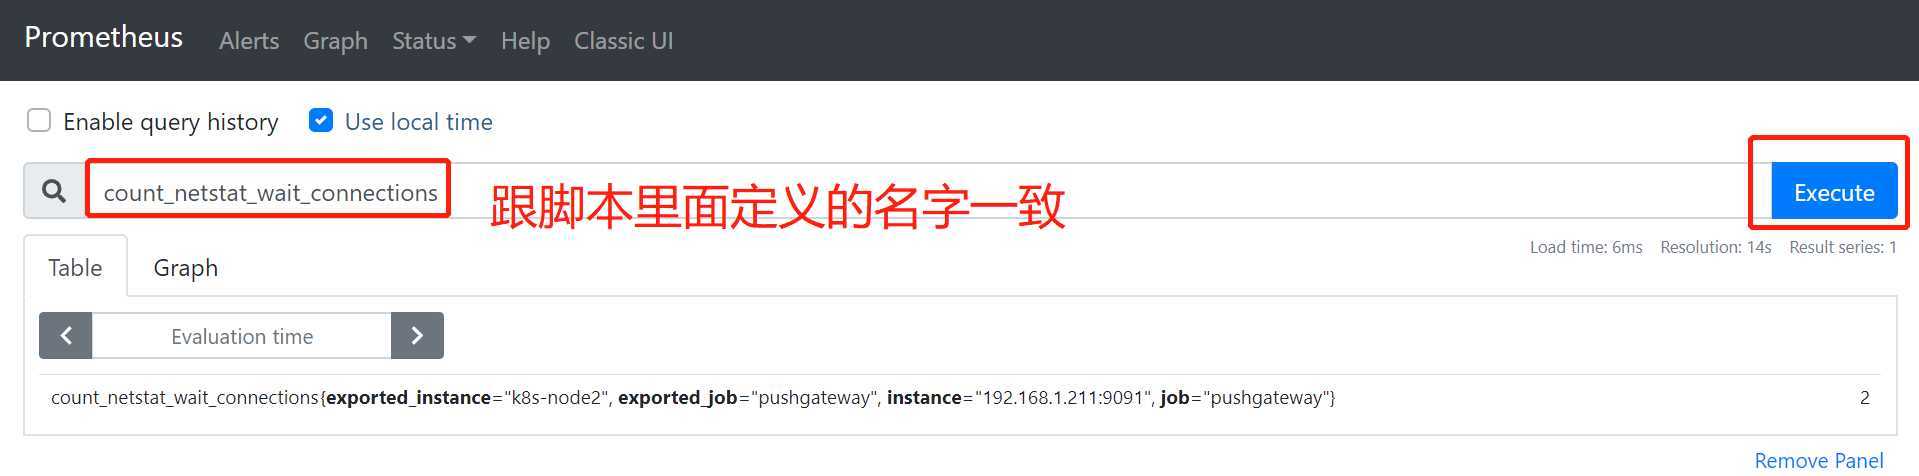
count_netstat_wait_connections=`netstat -an | grep -i wait | wc -l`
echo "count_netstat_wait_connections $count_netstat_wait_connections" | curl --data-binary @- http://192.168.1.211:9091/metrics/job/pushgateway/instance/$instance_name
然后设置crontab */1 * * * * bash /prometheus/pushgateway.sh
当然自己写的脚本要结合crontab去定时执行
如果希望 ?于?分钟的间隔 15s ,就用sleep
然后去监控页面查看图表是否生成:
url解释:
最后 把 key & value 推送给 pushgatway
curl —data-binary 将HTTP POST请求中的数据发送给HTTP服务器?(pushgateway), 与?用户提交HTML表单时浏览器?的?行行为完全?一样。 HTTP POST请求中的数据为纯二进制数据
http://prometheus.server.com:9091/metrics/job/pushgateway1/ instance/$instance_name
最后这? ?POST ?式 把 key & value 推送给 pushgatway的URL地址
这个URL地址中 分成如下三个部分 :
http://prometheus.server.com:9091/metrics/job/pushgateway1?
这?是 URL的主location
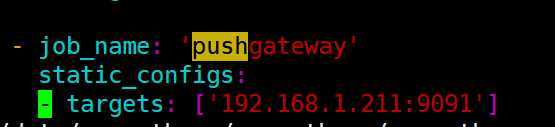
job/pushgateway1?
这?是 第?部分 ?第?个标签: 推送到 哪?个prometheus.yml 定义的 job?
{instance=“server01"}
instance/$instance_name
这?是 第?个标签 推送后 显?的 机器名是什
原文:https://www.cnblogs.com/huningfei/p/12715234.html