npm install echarts -S
// 引入Echarts
import echarts from ‘echarts‘
Vue.prototype.$echarts = echarts
<template>
<div id="myChart" :style="{width: ‘500px‘, height: ‘500px‘}"></div>
</template>
<script>
export default {
data () {
return {
}
},
mounted(){
this.drawLine();
},
methods: {
drawLine(){
// 初始化Echarts实例
let myChart = this.$echarts.init(document.getElementById(‘myChart‘))
// 绘制图表
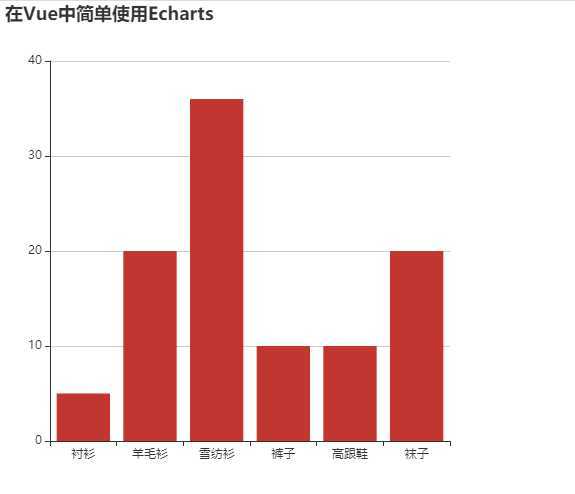
myChart.setOption({
title: { text: ‘在Vue中简单使用Echarts‘ },
tooltip: {},
xAxis: {
data: ["衬衫","羊毛衫","雪纺衫","裤子","高跟鞋","袜子"]
},
yAxis: {},
series: [{
name: ‘销量‘,
type: ‘bar‘,
data: [5, 20, 36, 10, 10, 20]
}]
});
}
}
}
</script>
原文:https://www.cnblogs.com/xudaxian/p/12714513.html