一.主题式网络爬虫设计方案
1.爬虫名称:爬取2020搜狗热搜电影
2.爬取内容:影片的排名及其评分
3.网络爬虫设计方案的大致内容:
网页内容的选取 对所选取网页进行html解析 ,单击鼠标右键查看网页源代码,找到关键内容的索引标签,对标签进行分析理解,提取关键字眼。
导入第三方库,再将所爬取到的内容进行数据清洗.分析,绘制图形方程,以及可视化处理
4.技术难点:在进行标签寻找时,父子标签无法正常提取 以及在读取csv文件时,文档的编码格式存在问题,以及在后置图形绘制的时候图象标题无法
正常显示中文。
二.主题页面的html分析
1.主题页面的结构与特征分析:找到所需要的爬取数据都在div class="tt"标签下,在寻找到各个评分标签span class="ws" span class="nn"名称标签。


三,网络爬虫的程序设计代码:
1.数据的爬取及采集
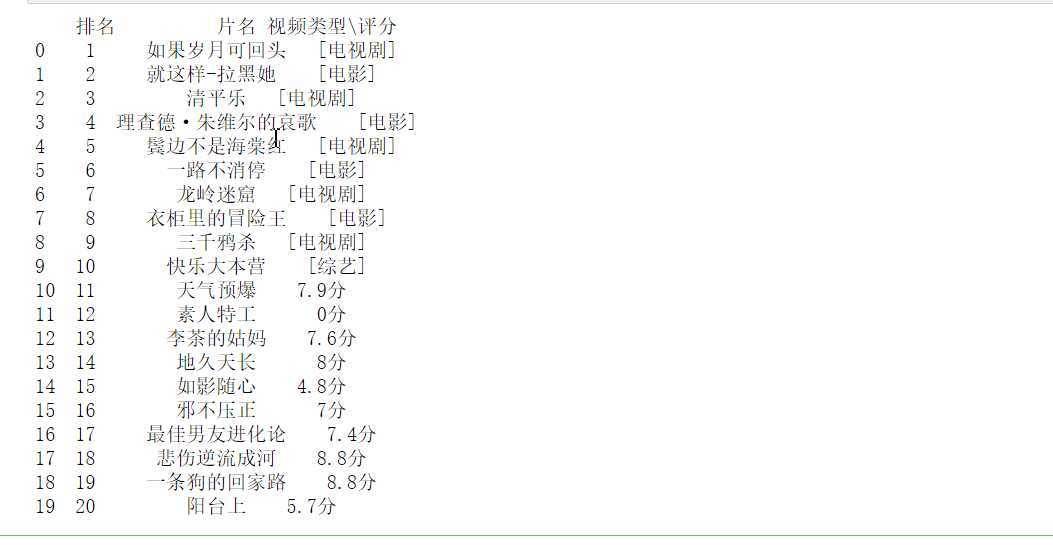
def get_html(url):
    headers = {‘user-agent‘: ‘Mozilla/5.0 (Windows NT 10.0; Win64; x64) AppleWebKit/537.36 (KHTML, like Gecko) Chrome/70.0.3538.102 Safari/537.36 Edge/18.18362‘}#伪装爬虫
    resp = requests.get(url, headers = headers)
    return resp.text

url = ‘http://kan.sogou.com/‘
html = get_html(url)
soup = BeautifulSoup(html, ‘html.parser‘)


#排名
b=soup.find_all(‘div‘,class_=‘tt‘)

#片名
v=soup.find_all(‘a‘,class_=‘nn‘)

#视频类型
rating_score = soup.find_all(‘span‘, class_=‘jishu‘)


curry = []
num =20
for i in range(num):
    curry.append([i+1,v[i].string, rating_score[i].string])
df = pd.DataFrame(curry,columns = [‘排名‘, ‘片名‘, ‘视频类型\评分‘])
print(df)
#将文件保存,使数据可修改
df.to_csv(‘2020搜狗热搜电影数据‘)
2,数据的清洗及处理分析
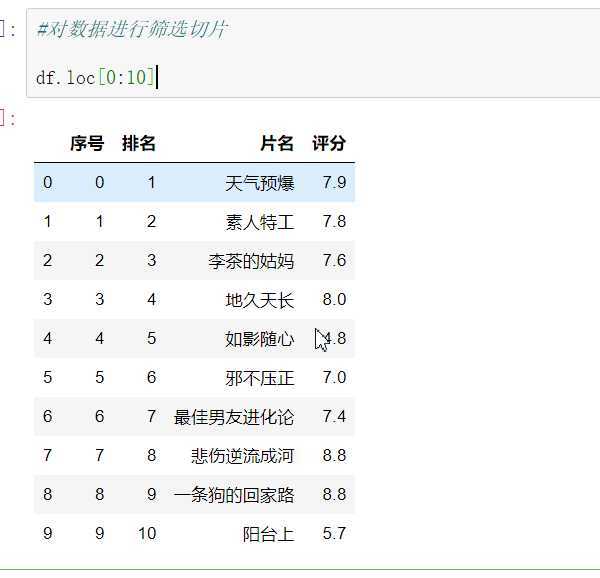
#读取文件  显示前10行

df = pd.DataFrame(pd.read_csv(‘D:\\jupyy\\2020sougo.csv‘))
df.head(10)

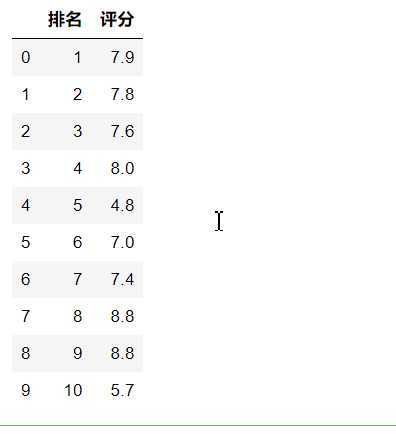
#删除无效行和列

df.drop(‘片名‘, axis=1, inplace = True)
df.drop(‘序号‘, axis=1, inplace = True)
df.head(10)
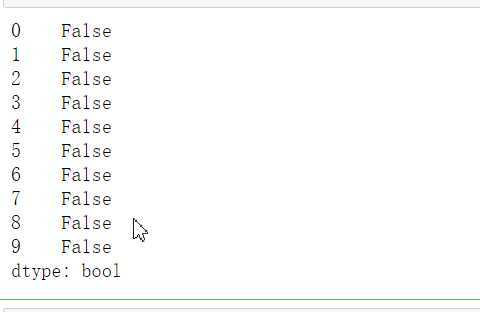
#检查是否有重复值
df.duplicated()
#对空值进行处理

df.isnull().sum()     #返回0,则表示没有空值
#缺失值处理

df[df.isnull().values==True]   #返回无缺失值

#用describe()命令显示描述性统计指标
df.describe()
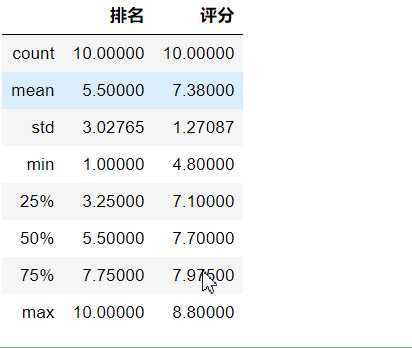
#用describe()命令显示描述性统计指标
df.describe()
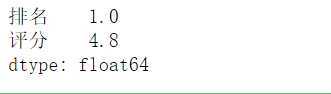
#求最小值

df.min()
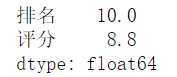
#求最大值

df.max()
#数据分析
X = df.drop("排名",axis=1)
predict_model = LinearRegression()
predict_model.fit(X,df[‘评分‘])
print("回归系数为:",predict_model.coef_)
3,数据分析可视化
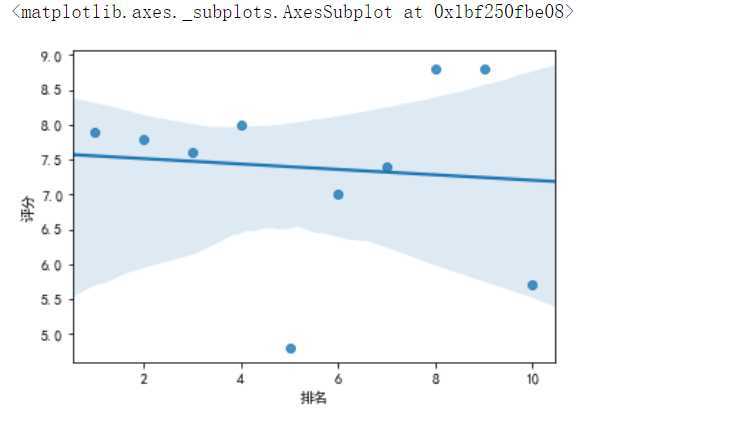
#绘制排名与评分的回归图
from pylab import *
plt.rcParams[‘font.sans-serif‘]=[‘SimHei‘]#显示中文
sns.regplot(df.排名,df.评分)
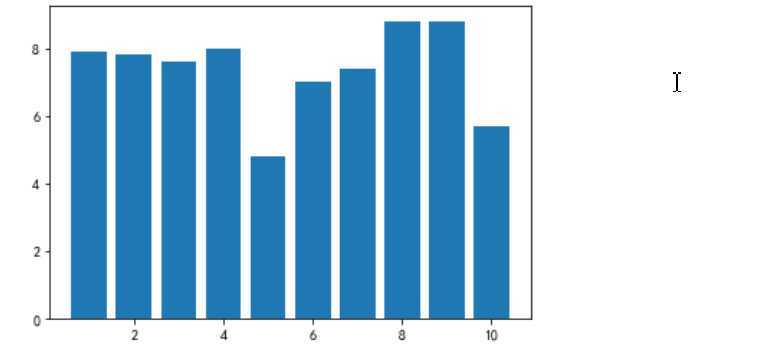
# 绘制垂直柱状图
plt.rcParams[‘axes.unicode_minus‘]=False #用来正常显示负号
plt.bar(df.排名, df.评分, label="排名与评分柱状图")
plt.show()
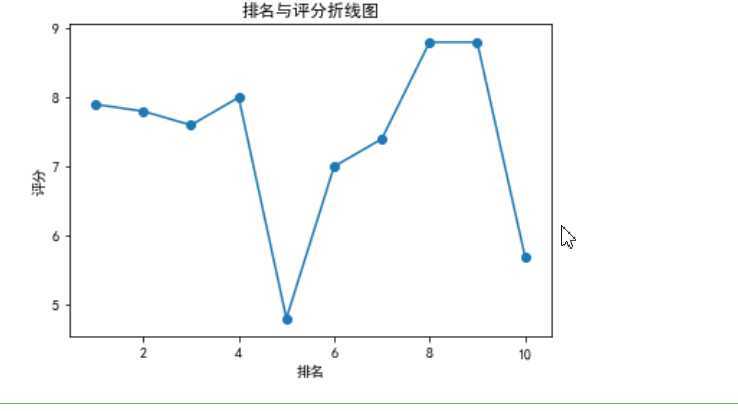
def fill():

    x = df[‘排名‘]
    y = df[‘评分‘]
    plt.xlabel(‘排名‘)
    plt.ylabel(‘评分‘)
    plt.plot(x,y)
    plt.scatter(x,y)
    plt.title("排名与评分折线图")
    plt.show()

fill()
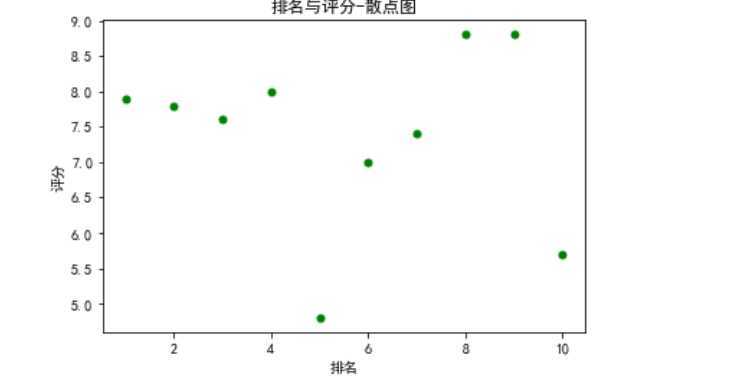
def fill0():

    plt.scatter(df.排名, df.评分, color=‘green‘, s=25, marker="o")
    plt.xlabel("排名")
    plt.ylabel("评分")
    plt.title("排名与评分-散点图")
    plt.show()

fill0()
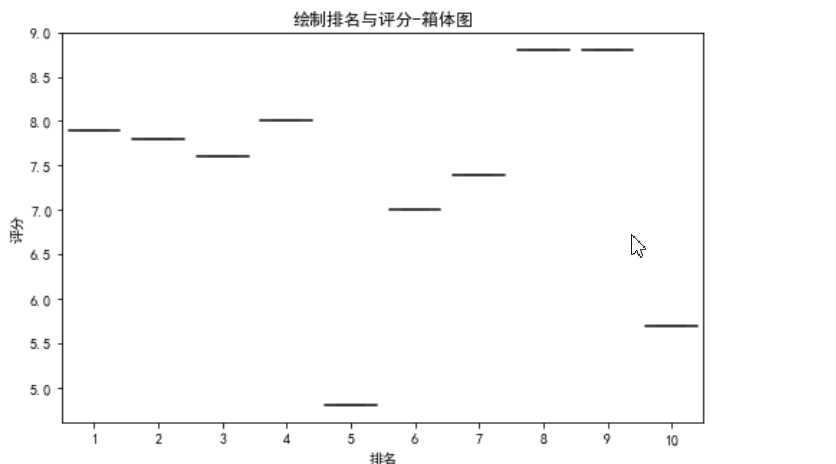
#绘制排名与评分-箱体图(盒图)
def fill2():

    plt.figure(figsize=(8, 5))
    plt.title(‘绘制排名与评分-箱体图‘)
    sns.boxplot(x=‘排名‘,y=‘评分‘, data=df)

fill2()
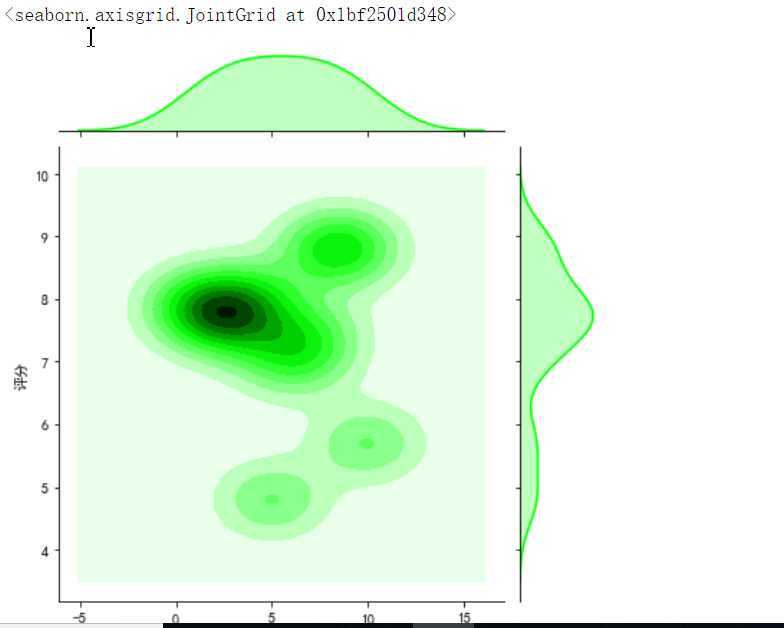
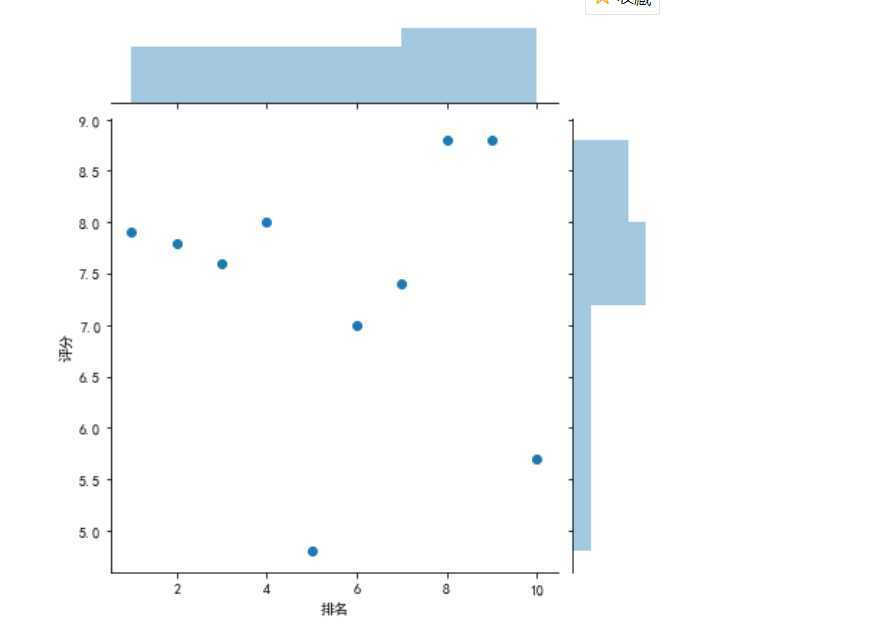
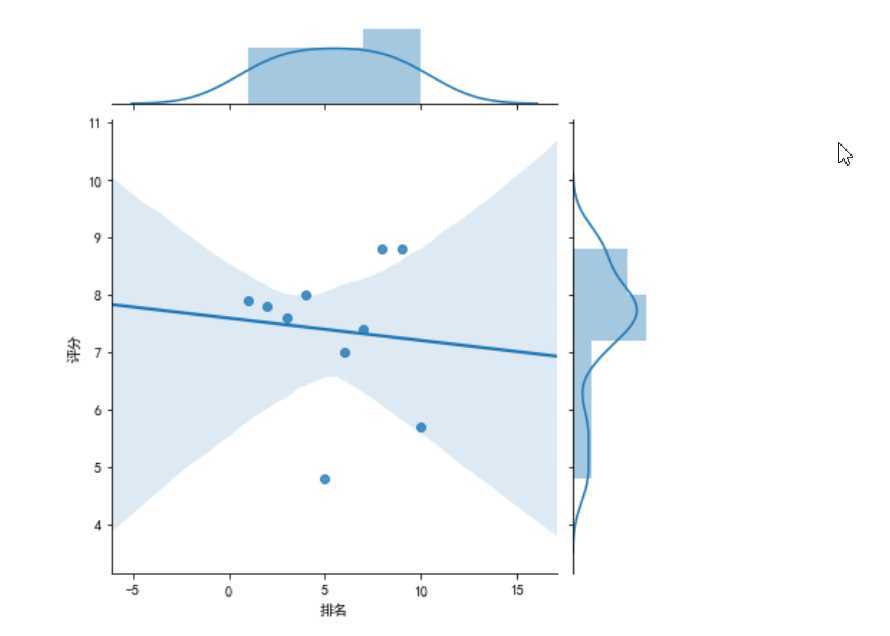
#绘制部分分布图
sns.jointplot(x="排名",y=‘评分‘,data = df, kind=‘kde‘, color=‘lime‘)

sns.jointplot(x="排名",y=‘评分‘,data = df)

sns.jointplot(x="排名",y=‘评分‘,data = df, kind=‘reg‘)

sns.jointplot(x="排名",y=‘评分‘,data = df, kind=‘hex‘)

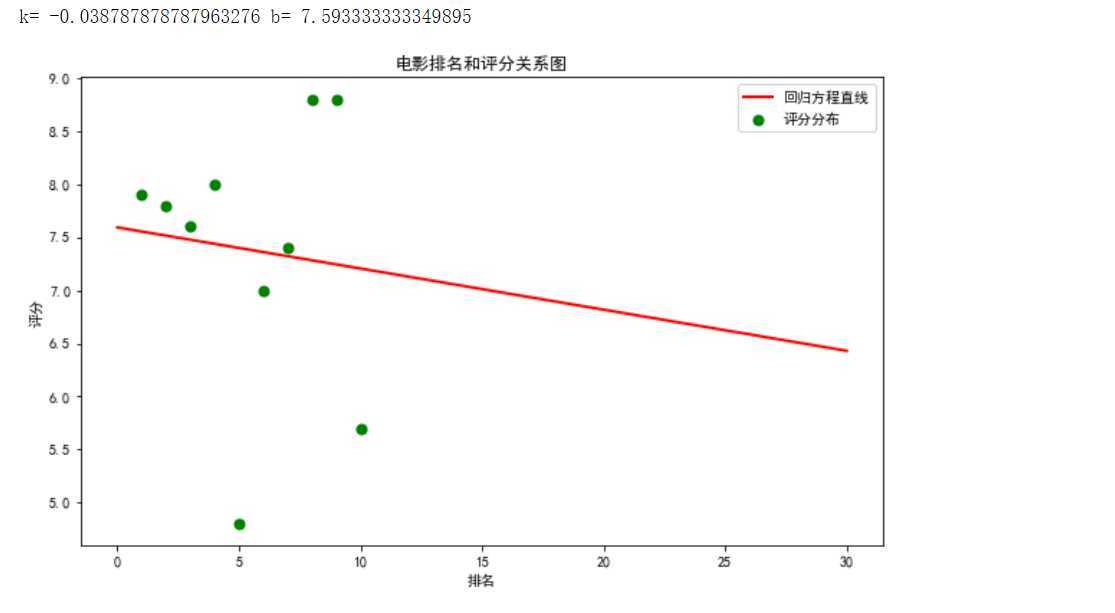
4.根据数据之间的关系绘制散点图,并进行方程的构建拟合出关系曲线图。
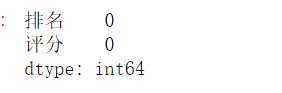
#绘制一元一次回归方程
def mainly():

    colnames = ["序号", "排名", "片名", "评分"]
    df = pd.read_csv(‘D:\\jupyy\\2020sougo.csv‘,skiprows=1,names=colnames)
    X = df.排名
    Y = df.评分

    def King(p, x):
        k, b = p
        return k * x + b

    def own_King(p, x, y):
        return King(p,x)-y
    p0 = [0,0]

    Para = leastsq(own_King, p0, args = (X, Y))
    k, b = Para[0]
    print("k=",k,"b=",b)

    plt.figure(figsize=(10,6))
    plt.scatter(X,Y,color="green",label=u"评分分布",linewidth=2)
    x=np.linspace(0,30,20)
    y=k*x+b
    plt.plot(x,y,color="red",label=u"回归方程直线",linewidth=2)

    plt.title("电影排名和评分关系图")
    plt.xlabel(‘排名‘)
    plt.ylabel(‘评分‘)
    plt.legend()
    plt.show()

mainly()
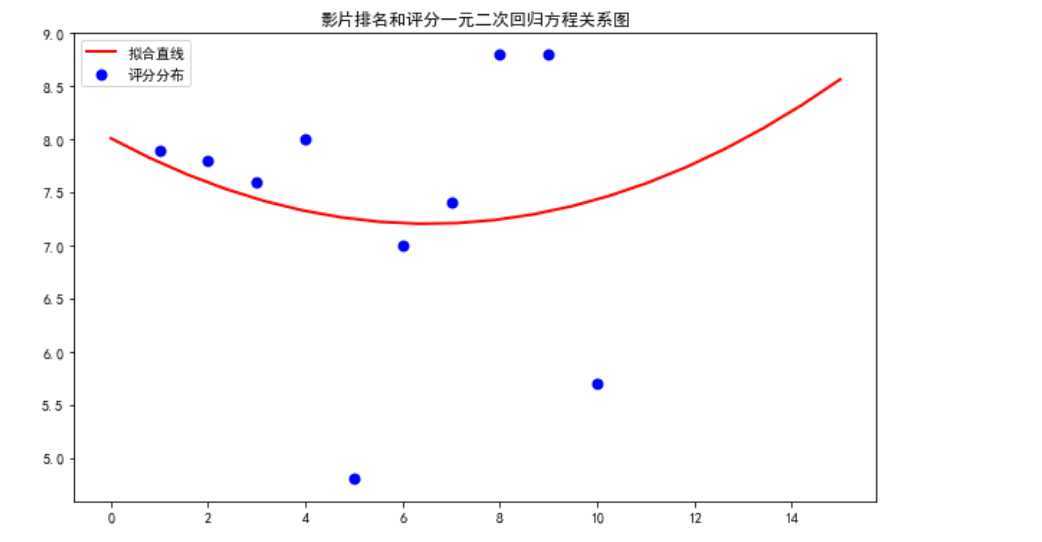
#绘制一元二次回归方程
def man():

    colnames = ["序号", "排名", "片名", "评分"]
    df = pd.read_csv(‘D:\\jupyy\\2020sougo.csv‘,skiprows=1,names=colnames)
    X = df.排名
    Y = df.评分

    def aim(p,x):
        a,b,c=p
        return a*x*x+b*x+c

    def error_aim(p,x,y):
        return aim(p,x)-y

    p0=[0,0,0]
    Para=leastsq(error_aim,p0,args=(X,Y))
    a,b,c=Para[0]
    plt.figure(figsize=(10,6))
    plt.scatter(X,Y,color="b",label=u"评分分布",linewidth=2)

    x=np.linspace(0,15,20)
    y=a*x*x+b*x+c
    plt.plot(x,y,color="r",label=u"拟合直线",linewidth=2)
    plt.title("影片排名和评分一元二次回归方程关系图")
    plt.legend()
    plt.show()

man()
5.对数据进行持久化处理,便于查看已经清理好的数据。
#数据持久化
def create_file(file_path,msg):        #定义一个创建文件夹,将爬取的资源用excel格式打开
    Resou =r‘D:\juppy\2020sogo.xlsx‘
    df = pd.DataFrame(msg,columns=[‘排名‘,‘片名‘,‘评分‘])
    df.to_excel(Resou)
    print(‘创建完成‘)
6.将以上各代码汇总,附上完整的程序代码:
import requests
from bs4 import BeautifulSoup
import pandas as pd
from sklearn.linear_model import LinearRegression
import seaborn as sns
import numpy as np
import matplotlib.pyplot as plt
import matplotlib
from scipy.optimize import leastsq
def get_html(url):
    headers = {‘user-agent‘: ‘Mozilla/5.0 (Windows NT 10.0; Win64; x64) AppleWebKit/537.36 (KHTML, like Gecko) Chrome/70.0.3538.102 Safari/537.36 Edge/18.18362‘}#伪装爬虫
    resp = requests.get(url, headers = headers)
    return resp.text

url = ‘http://kan.sogou.com/‘
html = get_html(url)
soup = BeautifulSoup(html, ‘html.parser‘)


#排名
b=soup.find_all(‘div‘,class_=‘tt‘)

#片名
v=soup.find_all(‘a‘,class_=‘nn‘)

#视频类型
rating_score = soup.find_all(‘span‘, class_=‘jishu‘)


curry = []
num =20
for i in range(num):
    curry.append([i+1,v[i].string, rating_score[i].string])
df = pd.DataFrame(curry,columns = [‘排名‘, ‘片名‘, ‘视频类型\评分‘])
print(df)
#将文件保存,使数据可修改
df.to_csv(‘2020搜狗热搜电影数据‘)
#读取文件  显示前10行

df = pd.DataFrame(pd.read_csv(‘D:\\jupyy\\2020sougo.csv‘))
df.head(10)
#对数据进行筛选切片

df.loc[0:10]
#删除无效行和列

df.drop(‘片名‘, axis=1, inplace = True)
df.drop(‘序号‘, axis=1, inplace = True)
df.head(10)
#检查是否有重复值
df.duplicated()
#对空值进行处理

df.isnull().sum()     #返回0,则表示没有空值
#缺失值处理

df[df.isnull().values==True]   #返回无缺失值
#用describe()命令显示描述性统计指标
df.describe()
#求最小值

df.min()
#求最大值

df.max()
#数据分析

X = df.drop("排名",axis=1)
predict_model = LinearRegression()
predict_model.fit(X,df[‘评分‘])
print("回归系数为:",predict_model.coef_)
#绘制排名与评分的回归图


from pylab import *
plt.rcParams[‘font.sans-serif‘]=[‘SimHei‘]#显示中文
sns.regplot(df.排名,df.评分)
# 绘制垂直柱状图

plt.rcParams[‘axes.unicode_minus‘]=False #用来正常显示负号
plt.bar(df.排名, df.评分, label="排名与评分柱状图")
plt.show()

#绘制折线图
def fill():

    x = df[‘排名‘]
    y = df[‘评分‘]
    plt.xlabel(‘排名‘)
    plt.ylabel(‘评分‘)
    plt.plot(x,y)
    plt.scatter(x,y)
    plt.title("排名与评分折线图")
    plt.show()

fill()

#绘制散点图
def fill0():

    plt.scatter(df.排名, df.评分, color=‘green‘, s=25, marker="o")
    plt.xlabel("排名")
    plt.ylabel("评分")
    plt.title("排名与评分-散点图")
    plt.show()

fill0()

#绘制排名与评分-箱体图(盒图)
def fill2():

    plt.figure(figsize=(8, 5))
    plt.title(‘绘制排名与评分-箱体图‘)
    sns.boxplot(x=‘排名‘,y=‘评分‘, data=df)

fill2()

#绘制部分分布图
sns.jointplot(x="排名",y=‘评分‘,data = df, kind=‘kde‘, color=‘lime‘)

sns.jointplot(x="排名",y=‘评分‘,data = df)

sns.jointplot(x="排名",y=‘评分‘,data = df, kind=‘reg‘)

sns.jointplot(x="排名",y=‘评分‘,data = df, kind=‘hex‘)


#绘制一元一次回归方程
def mainly():

    colnames = ["序号", "排名", "片名", "评分"]
    df = pd.read_csv(‘D:\\jupyy\\2020sougo.csv‘,skiprows=1,names=colnames)
    X = df.排名
    Y = df.评分

    def King(p, x):
        k, b = p
        return k * x + b

    def own_King(p, x, y):
        return King(p,x)-y
    p0 = [0,0]

    Para = leastsq(own_King, p0, args = (X, Y))
    k, b = Para[0]
    print("k=",k,"b=",b)

    plt.figure(figsize=(10,6))
    plt.scatter(X,Y,color="green",label=u"评分分布",linewidth=2)
    x=np.linspace(0,30,20)
    y=k*x+b
    plt.plot(x,y,color="red",label=u"回归方程直线",linewidth=2)

    plt.title("电影排名和评分关系图")
    plt.xlabel(‘排名‘)
    plt.ylabel(‘评分‘)
    plt.legend()
    plt.show()

mainly()

#绘制一元二次回归方程
def man():

    colnames = ["序号", "排名", "片名", "评分"]
    df = pd.read_csv(‘D:\\jupyy\\2020sougo.csv‘,skiprows=1,names=colnames)
    X = df.排名
    Y = df.评分

    def aim(p,x):
        a,b,c=p
        return a*x*x+b*x+c

    def error_aim(p,x,y):
        return aim(p,x)-y

    p0=[0,0,0]
    Para=leastsq(error_aim,p0,args=(X,Y))
    a,b,c=Para[0]
    plt.figure(figsize=(10,6))
    plt.scatter(X,Y,color="b",label=u"评分分布",linewidth=2)

    x=np.linspace(0,15,20)
    y=a*x*x+b*x+c
    plt.plot(x,y,color="r",label=u"拟合直线",linewidth=2)
    plt.title("影片排名和评分一元二次回归方程关系图")
    plt.legend()
    plt.show()

man()

#数据持久化
def create_file(file_path,msg):        #定义一个创建文件夹,将爬取的资源用excel格式打开
    Resou =r‘D:\juppy\2020sogo.xlsx‘
    df = pd.DataFrame(msg,columns=[‘排名‘,‘片名‘,‘评分‘])
    df.to_excel(Resou)
    print(‘创建完成‘)
四.结论:
经过python对网络爬虫的学习,让自己深刻了解到了python这门语言强大的功能,以及对数据处理的简便与快捷,让数据以更生动
形象具体的方式呈现在我们眼前,同时了解到自身对这门语言的理解还不够透彻,在处理很多方面细节不够到位,让自己认识到更多
的不足,同时加深了对这门语言的热爱。期间看过大量的教学视频,查找了大量的第三方库的使用。
原文:https://www.cnblogs.com/wanlsj/p/12704604.html