1》canvas是什么?
a)是一个html5新增的标签
b)是一个画布,可以通过js的api添加图案
2》canvas能做什么?使用场景 应用场景:
1》做游戏 2》画图案
3》canvas使用
a) <canvas></canvas>
b) 创建一个2d对象 getContext("2d") ps:3d需要插件的支持
c) 画内容
4》canvas填充
一、有填充
fillStyle ===》颜色
fillRect ===》位置、大小
二、无填充
****
canvas画布的宽度和高度,一般都在js中定义,如果在css中定义宽度和高度,内部元素也会受到影响
5》canvas画线条
1>起始点:moveTo(x,y);
2>结束点: lineTo(x,y);
3>开始画:stroke()
辅助:
线条加粗 : 2d对象.lineWidth = 5
线条颜色 : 2d对象.strokeStyle=‘red‘
填充颜色 :
2d对象.fillStyle=‘red‘
2d对象.fill() ==》加入次方法才可以填充
1》beginPath:方法开始一条路径,或重置当前的路径。
2》closePath: 方法创建从当前点到开始点的路径。
6》canvas画圆
2d对象.arc()
arc(x,y,r,sAngle,eAngle,counterclockwise);
x:横向位置
y:垂直位置
r:半径
sAngle:起始点
eAngle:结束点
counterclockwise:方向
false ==>顺时针
下面是写的几个案例
1.太极图
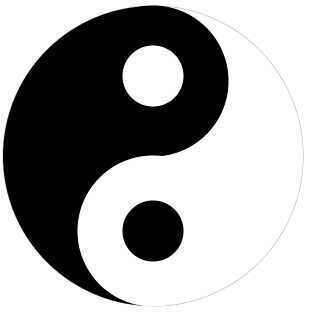
源码
<canvas id="mycanvas"></canvas>
    <script>
        var mycanvas = document.getElementById("mycanvas");
        mycanvas.width = 500;
        mycanvas.height = 500;
        var cvs = mycanvas.getContext("2d");
        // 左边黑圆
        cvs.arc(300, 300, 150, 0, 2 * Math.PI);
        cvs.strokeStyle = "#ccc"
        cvs.stroke();
        cvs.fillStyle = "#000";
        cvs.fill();

        // 右边白圆
        cvs.beginPath();
        cvs.arc(300, 300, 150, 1.5 * Math.PI, 0.5 * Math.PI);
        // cvs.strokeStyle="#ccc"
        cvs.stroke();
        cvs.fillStyle = "#FFF";
        cvs.fill();
        // 上边黑圆
        cvs.beginPath();
        cvs.arc(300, 225, 75, 0, 2 * Math.PI);
        cvs.strokeStyle = "#000"
        cvs.stroke();
        cvs.fillStyle = "#000";
        cvs.fill();
        // 下边白圆
        cvs.beginPath();
        cvs.arc(300, 375, 75, 0, 2 * Math.PI);
        cvs.strokeStyle = "#fff"
        cvs.stroke();
        cvs.fillStyle = "#fff";
        cvs.fill();

        //上边黑圆中的白圆
        cvs.beginPath();
        cvs.arc(300, 220, 30, 0, 2 * Math.PI);
        cvs.strokeStyle = "#fff"
        cvs.stroke();
        cvs.fillStyle = "#fff";
        cvs.fill();

         //上边白圆中的黑圆
         cvs.beginPath();
        cvs.arc(300, 375, 30, 0, 2 * Math.PI);
        cvs.strokeStyle = "#000"
        cvs.stroke();
        cvs.fillStyle = "#000";
        cvs.fill();
2.钟表
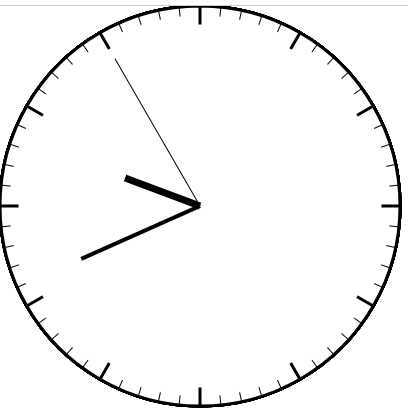
源码
 <canvas id="mycanvas"></canvas>
    <script>
        var mycanvas = document.getElementById("mycanvas");
        mycanvas.width = 800;
        mycanvas.height = 500;
        var cvs = mycanvas.getContext("2d");
        // cvs.moveTo(50, 50);
        // cvs.arc(50, 50, 50, 0, 6 * Math.PI/180);
        function time(){
        //    绘制原型带刻度
        var x = 200;
        y = 200;
        r = 200;
        //获取当前时间
        date=new Date();
        hour=date.getHours();
        minutes=date.getMinutes();
       seconds=date.getSeconds();
        //给度数减去90  时针过半需要分钟/2
        var  H=(-90+hour*30+(minutes/2))*Math.PI/180;
        var M=(-90+minutes*6)*Math.PI/180;
        var S=(-90+seconds*6)*Math.PI/180;
        cvs.arc(x, y, r, 0, 360 * Math.PI / 180);
        cvs.strokeStyle = "#ccc";
        cvs.stroke();
        cvs.closePath();
        cvs.beginPath();
        //分针k刻度
        for (var i = 0; i < 60; i++) {
            cvs.moveTo(x, y);
            cvs.arc(x, y, r, i * 6 * Math.PI / 180, (i + 1) * 6 * Math.PI / 180);
        }
        cvs.strokeStyle = "#000";
        cvs.stroke();
        cvs.closePath();
        //用圆覆盖,只流短刻度
        cvs.beginPath();
        cvs.arc(x, y, r * (19 / 20), 0, 2 * Math.PI);
        cvs.fillStyle = "#fff";
        cvs.fill();
        cvs.strokeStyle = "#fff";
        cvs.stroke();


        //    时针刻度
        cvs.beginPath();
        for (var i = 0; i < 12; i++) {
            cvs.moveTo(x, y);
            cvs.arc(x, y, r, i * 30 * Math.PI / 180, (i + 1) * 30 * Math.PI / 180);
        }
        cvs.lineWidth = 3;
        cvs.strokeStyle = "#000";
        cvs.stroke();

        //用圆覆盖,只流短刻度
        cvs.beginPath();
        cvs.arc(x, y, r * (18 / 20), 0, 2 * Math.PI);
        cvs.fillStyle = "#fff";
        cvs.fill();
        cvs.strokeStyle = "#fff";
        cvs.stroke();


        //时针
        cvs.beginPath();

        cvs.moveTo(x, y);
        cvs.arc(x, y, r * (8 / 20), H, H);

        cvs.lineWidth =5;
        cvs.strokeStyle = "#000";
        cvs.stroke();


        // 分针
        cvs.beginPath();

        cvs.moveTo(x, y);
        cvs.arc(x, y, r * (13 / 20), M, M);

        cvs.lineWidth = 3;
        cvs.strokeStyle = "#000";
        cvs.stroke();
        //秒针
        cvs.beginPath();

        cvs.moveTo(x, y);
        cvs.arc(x, y, r * (17 / 20), S, S);

        cvs.lineWidth = 1;
        cvs.strokeStyle = "#000";
        cvs.stroke();
    }
     time();
     setInterval(time,1000)
3.折线图
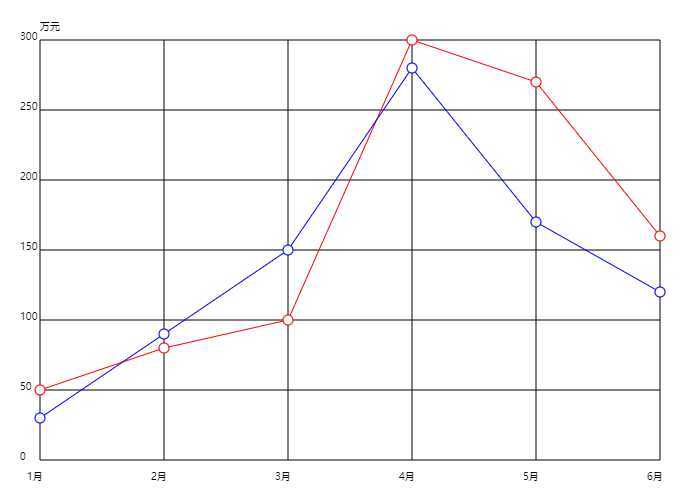
源码
<canvas id="mycanvas" width="700" height="500"></canvas>
    <script>
        function lineChart(obj, dom) {
            var cvs = dom.getContext("2d");
            width = dom.width;
            height = dom.height;
            data = obj;
            len = data.x.length;
            //间隔宽
            stepwidth = (width - 80) / (len - 1);
            //间隔高
            stepheight = (height - 80) / (data.y.length - 1);
            move = [40, 40];
            line = [40, height - 40];
            //竖线
            for (var i = 0; i < len; i++) {
                cvs.beginPath();
                cvs.fillText(data.x[i], line[0] - 13, line[1] + 20);
                cvs.moveTo(move[0], move[1]);
                cvs.lineTo(line[0], line[1]);
                move[0] += stepwidth;
                line[0] += stepwidth;
                cvs.stroke();
            }
            //单位
            cvs.fillText(data.yuninit, 40, 30);
            //横线
            var start = [40, 40];
            var end = [width - 40, 40]
            for (var i = 0; i < data.y.length; i++) {
                cvs.beginPath();
                cvs.fillText(data.y[i], start[0] - 20, (height - 40) - (i * stepheight));
                cvs.moveTo(start[0], start[1]);
                cvs.lineTo(end[0], end[1]);
                start[1] += stepheight;
                end[1] += stepheight;
                cvs.stroke();
            }
            //折线
            for (var i = 0; i < data.line.length; i++) {

                var item = data.line[i].data;

                    cvs.strokeStyle = data.line[i].color;
                for (var j = 0; j < item.length; j++) {
                    cvs.beginPath();
                    cvs.moveTo(40 + j * stepwidth, height - (height - 80) * (item[j] / data.y[data.y.length - 1]) - 40);
                    cvs.lineTo(40 + (j + 1) * stepwidth, height - (height - 80) * (item[j + 1] / data.y[data.y.length -
                        1]) - 40);
                        cvs.stroke();
                    //点呈圆形
                   cvs.beginPath();
                    cvs.arc(40 + j * stepwidth, height - (height - 80) * (item[j] / data.y[data.y.length - 1]) - 40, 5,
                        0, 2 * Math.PI);
                    cvs.fillStyle = "#fff";
                    cvs.fill();
                    cvs.stroke();
                }


            }

        }
        new lineChart({
            x: ["1月", "2月", "3月", "4月", "5月", "6月"],
            y: [0, 50, 100, 150, 200, 250, 300],
            yuninit: "万元",
            line: [{
                    color: "red",
                    data: [50, 80, 100, 300, 270, 160]
                },
                {
                    color: "blue",
                    data: [30, 90, 150, 280, 170, 120]
                },
            ]

        }, document.getElementById("mycanvas"))
原文:https://www.cnblogs.com/cyhsmile/p/12669808.html