./metricbeat -e
主要是采集指标,,比如cpu,io,内存的运行情况,将指标的数据存储到elasticsearch中勒,,
两部分组成,
Module:收集对象,,MySQL,Redis,Nginx,,操作系统等,
Metricset:收集指标的集合,,像 cpu,mem,network等
下载 https://www.elastic.co/cn/downloads/beats/metricbeat
上传,解压,,,看下解压后的各种文件啥的,
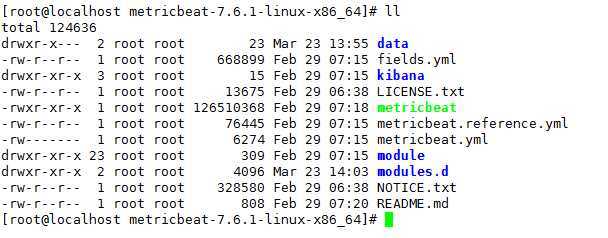
配置文件是metricbeat.yml,,
在modules.d中:
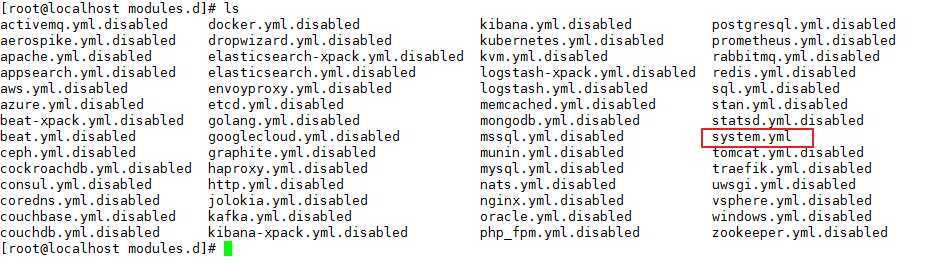
默认开启了system.yml,,可以看下。。
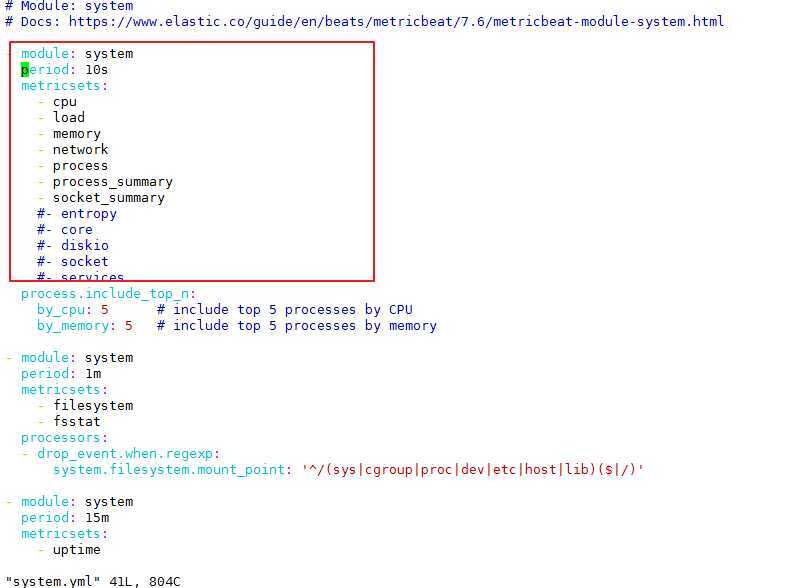
框里是收集的指标,,会传到elasticsearch,,
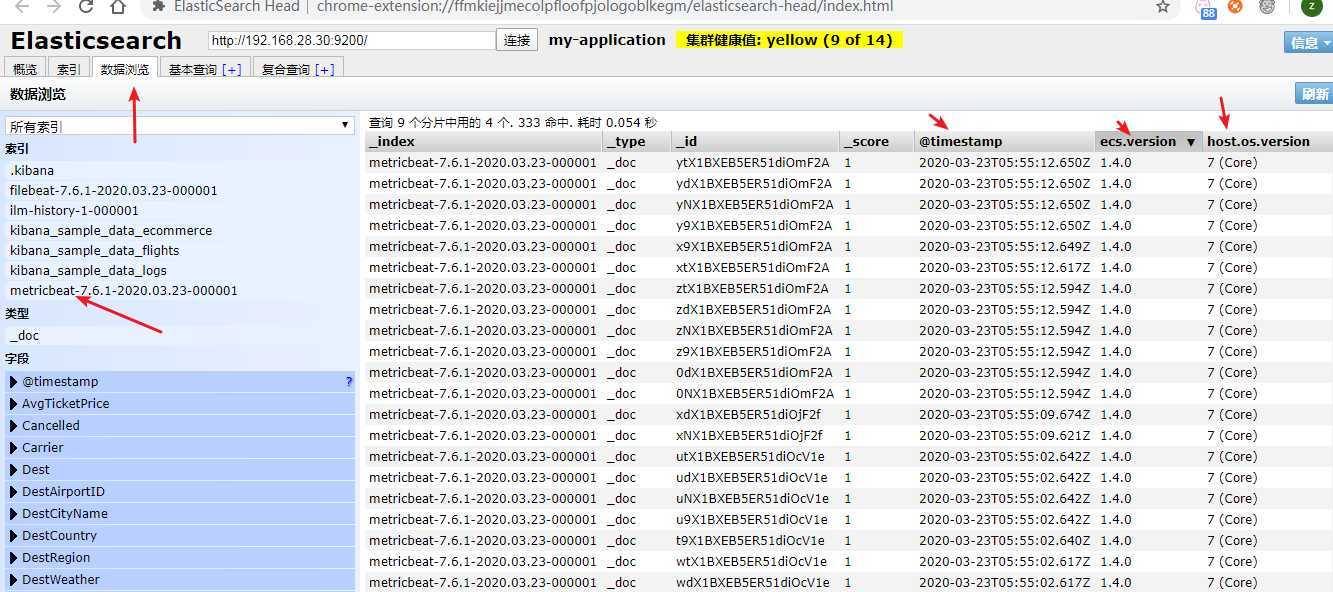
启动Metricbeat,,再到elasticsearch-head中查看
启动:
metricbeat根目录下,,
./metricbeat -e
查看,,
好多信息,,
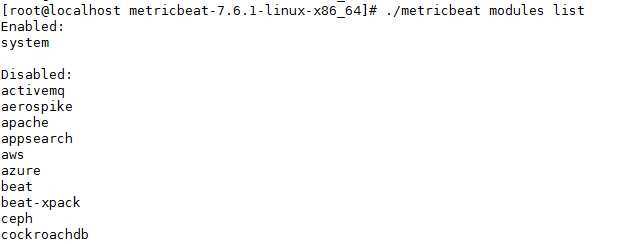
查看modules列表:
metricbeat根目录执行
./metricbeat modules list
 。
。
。
。
。
很多
以nginx为例,,先开启nginx状态查询。。
先重新编译安装
[root@localhost nginx-1.16.1]# ./configure --prefix=/usr/local/nginx --with-http_stub_status_module
[root@localhost nginx-1.16.1]# make && makeinstall
编译完成之后,查看
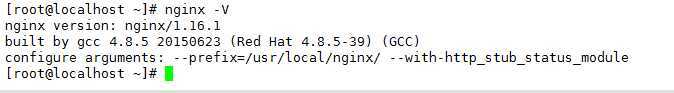
出现"configure arguments: --prefix=/usr/local/nginx/ --with-http_stub_status_module",表示模块添加成功,,
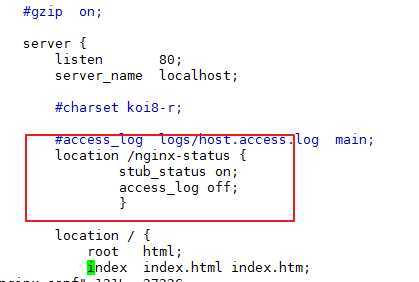
在nginx配置文件添加配置项,,在server段后面添加
nginx -t查看是否配置文件有错误

没有,,嘿嘿嘿继续
启动nginx,,在页面上显示
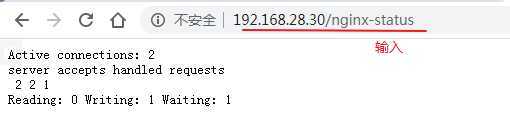
Active connections:当前处理的活跃连接数
server 阿车村epts handled requests
第一个server表示nginx启动到现在共处理2个连接,
第二个server表示nginx启动到现在共创建2次握手,
第三个handled requests表示处理1次请求。。
请求丢失数=握手数-连接数
Reading:0 Writing:1 Waiting: 1
Reading: nginx读取客户端的header信息数
Writing:nginx返回给客户端的header信息数
Waiting:nginx已经处理完正在dengdai下一次请求指令的驻留链接(开启keep-alive的情况这个值=Actice-(Reading+Writing))
为了试验先将之前的metricbeat删除,并停止system的收集,
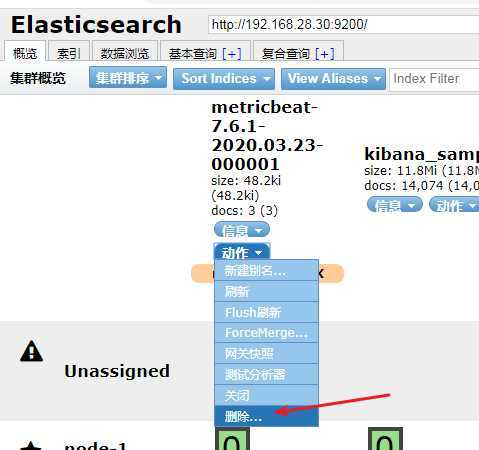
执行停止system数据的收集
./metricbeat modules disable system
,,,在将nginx的开启
./metricbeat modules enable nginx
查看

修改nginx.yml
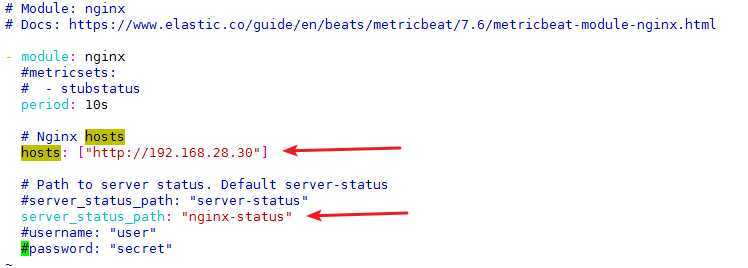
回到根目录启动,,metricbeat,
./metricbeat -e
启动成功,,查看elasticsearch-head,,,刷新,,在等一小下,,发现metricbeat又出现了,恩,在看下
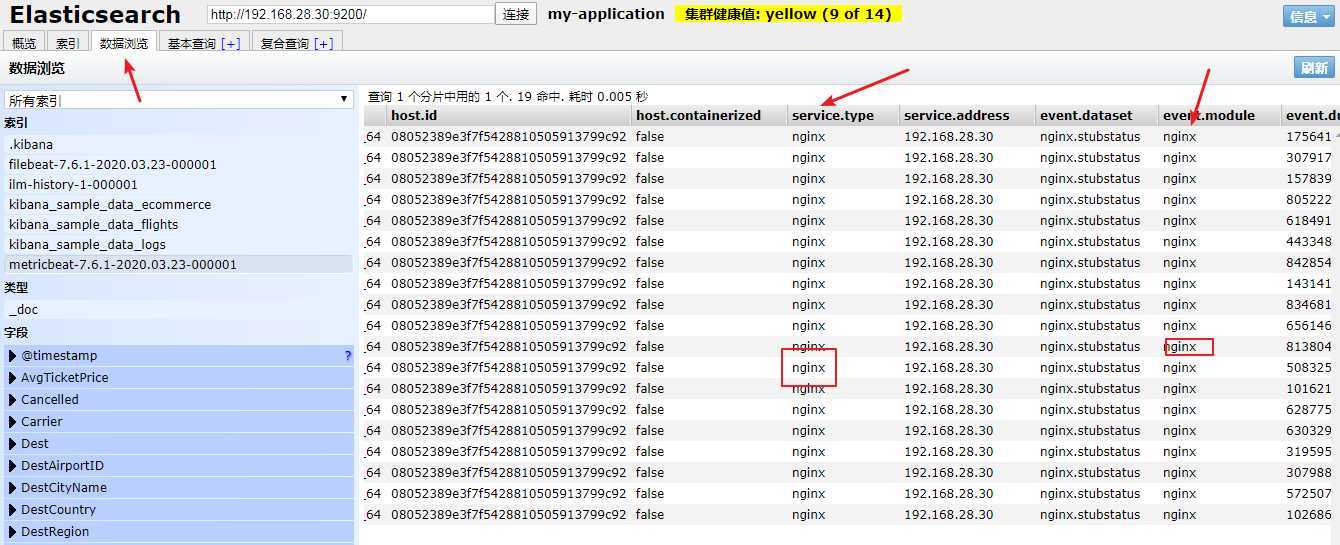
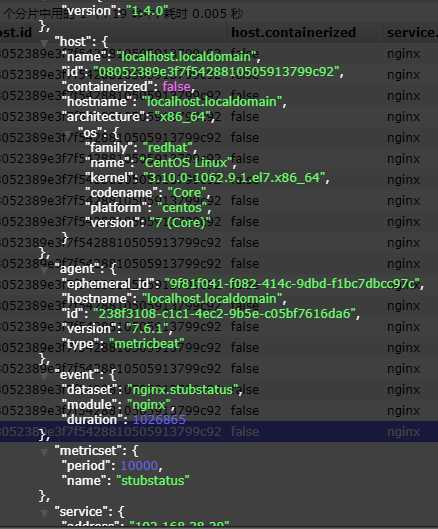
就这样
原文:https://www.cnblogs.com/5444de/p/12552505.html