import pandas as pd
import numpy as np
from matplotlib import pyplot as plt
# 导入数据
file_path = "C:/Users/pc/Desktop/kobe_data.csv"
df = pd.read_csv(file_path)
print(df.shape)
df.head(10)(30697, 25)| action_type | combined_shot_type | game_event_id | game_id | lat | loc_x | loc_y | lon | minutes_remaining | period | ... | shot_type | shot_zone_area | shot_zone_basic | shot_zone_range | team_id | team_name | game_date | matchup | opponent | shot_id | |
|---|---|---|---|---|---|---|---|---|---|---|---|---|---|---|---|---|---|---|---|---|---|
| 0 | Jump Shot | Jump Shot | 10 | 20000012 | 33.9723 | 167 | 72 | -118.1028 | 10 | 1 | ... | 2PT Field Goal | Right Side(R) | Mid-Range | 16-24 ft. | 1610612747 | Los Angeles Lakers | 2000-10-31 | LAL @ POR | POR | 1 |
| 1 | Jump Shot | Jump Shot | 12 | 20000012 | 34.0443 | -157 | 0 | -118.4268 | 10 | 1 | ... | 2PT Field Goal | Left Side(L) | Mid-Range | 8-16 ft. | 1610612747 | Los Angeles Lakers | 2000-10-31 | LAL @ POR | POR | 2 |
| 2 | Jump Shot | Jump Shot | 35 | 20000012 | 33.9093 | -101 | 135 | -118.3708 | 7 | 1 | ... | 2PT Field Goal | Left Side Center(LC) | Mid-Range | 16-24 ft. | 1610612747 | Los Angeles Lakers | 2000-10-31 | LAL @ POR | POR | 3 |
| 3 | Jump Shot | Jump Shot | 43 | 20000012 | 33.8693 | 138 | 175 | -118.1318 | 6 | 1 | ... | 2PT Field Goal | Right Side Center(RC) | Mid-Range | 16-24 ft. | 1610612747 | Los Angeles Lakers | 2000-10-31 | LAL @ POR | POR | 4 |
| 4 | Driving Dunk Shot | Dunk | 155 | 20000012 | 34.0443 | 0 | 0 | -118.2698 | 6 | 2 | ... | 2PT Field Goal | Center(C) | Restricted Area | Less Than 8 ft. | 1610612747 | Los Angeles Lakers | 2000-10-31 | LAL @ POR | POR | 5 |
| 5 | Jump Shot | Jump Shot | 244 | 20000012 | 34.0553 | -145 | -11 | -118.4148 | 9 | 3 | ... | 2PT Field Goal | Left Side(L) | Mid-Range | 8-16 ft. | 1610612747 | Los Angeles Lakers | 2000-10-31 | LAL @ POR | POR | 6 |
| 6 | Layup Shot | Layup | 251 | 20000012 | 34.0443 | 0 | 0 | -118.2698 | 8 | 3 | ... | 2PT Field Goal | Center(C) | Restricted Area | Less Than 8 ft. | 1610612747 | Los Angeles Lakers | 2000-10-31 | LAL @ POR | POR | 7 |
| 7 | Jump Shot | Jump Shot | 254 | 20000012 | 34.0163 | 1 | 28 | -118.2688 | 8 | 3 | ... | 2PT Field Goal | Center(C) | Restricted Area | Less Than 8 ft. | 1610612747 | Los Angeles Lakers | 2000-10-31 | LAL @ POR | POR | 8 |
| 8 | Jump Shot | Jump Shot | 265 | 20000012 | 33.9363 | -65 | 108 | -118.3348 | 6 | 3 | ... | 2PT Field Goal | Left Side(L) | In The Paint (Non-RA) | 8-16 ft. | 1610612747 | Los Angeles Lakers | 2000-10-31 | LAL @ POR | POR | 9 |
| 9 | Running Jump Shot | Jump Shot | 294 | 20000012 | 33.9193 | -33 | 125 | -118.3028 | 3 | 3 | ... | 2PT Field Goal | Center(C) | In The Paint (Non-RA) | 8-16 ft. | 1610612747 | Los Angeles Lakers | 2000-10-31 | LAL @ POR | POR | 10 |
10 rows × 25 columns
print(df.columns)
# 关键数据 loc_x、loc_y(出手位置坐标)和 shot_made_flag(是否投中)这三列。
print(df["shot_made_flag"].unique())
Index(['action_type', 'combined_shot_type', 'game_event_id', 'game_id', 'lat',
'loc_x', 'loc_y', 'lon', 'minutes_remaining', 'period', 'playoffs',
'season', 'seconds_remaining', 'shot_distance', 'shot_made_flag',
'shot_type', 'shot_zone_area', 'shot_zone_basic', 'shot_zone_range',
'team_id', 'team_name', 'game_date', 'matchup', 'opponent', 'shot_id'],
dtype='object')
[nan 0. 1.]# 去除空值行
kobe = df[pd.notnull(df["shot_made_flag"])]
print(kobe.shape)(25697, 25)# 动作类型
print(kobe.action_type.unique())
print(kobe.combined_shot_type.unique())
# 投篮类型 2分/3分
print(kobe.shot_type.unique())
# 投篮类型次数统计
print(kobe.shot_type.value_counts())['Jump Shot' 'Driving Dunk Shot' 'Layup Shot' 'Running Jump Shot'
'Reverse Dunk Shot' 'Slam Dunk Shot' 'Driving Layup Shot'
'Turnaround Jump Shot' 'Reverse Layup Shot' 'Tip Shot'
'Running Hook Shot' 'Alley Oop Dunk Shot' 'Dunk Shot'
'Alley Oop Layup shot' 'Running Dunk Shot' 'Driving Finger Roll Shot'
'Running Layup Shot' 'Finger Roll Shot' 'Fadeaway Jump Shot'
'Follow Up Dunk Shot' 'Hook Shot' 'Turnaround Hook Shot' 'Jump Hook Shot'
'Running Finger Roll Shot' 'Jump Bank Shot' 'Turnaround Finger Roll Shot'
'Hook Bank Shot' 'Driving Hook Shot' 'Running Tip Shot'
'Running Reverse Layup Shot' 'Driving Finger Roll Layup Shot'
'Fadeaway Bank shot' 'Pullup Jump shot' 'Finger Roll Layup Shot'
'Turnaround Fadeaway shot' 'Driving Reverse Layup Shot'
'Driving Slam Dunk Shot' 'Step Back Jump shot' 'Turnaround Bank shot'
'Reverse Slam Dunk Shot' 'Floating Jump shot' 'Putback Slam Dunk Shot'
'Running Bank shot' 'Driving Bank shot' 'Driving Jump shot'
'Putback Layup Shot' 'Putback Dunk Shot' 'Running Finger Roll Layup Shot'
'Pullup Bank shot' 'Running Slam Dunk Shot' 'Cutting Layup Shot'
'Driving Floating Jump Shot' 'Running Pull-Up Jump Shot' 'Tip Layup Shot'
'Driving Floating Bank Jump Shot']
['Jump Shot' 'Dunk' 'Layup' 'Tip Shot' 'Hook Shot' 'Bank Shot']
['2PT Field Goal' '3PT Field Goal']
2PT Field Goal 20285
3PT Field Goal 5412
Name: shot_type, dtype: int64# 职业生涯赛季
kobe['season'].unique()
# kobe['season'] = kobe['season'].apply(lambda x: int(x.split('-')[1]) )
# kobe['season'].unique()array(['2000-01', '2001-02', '2002-03', '2003-04', '2004-05', '2005-06',
'2006-07', '2007-08', '2008-09', '2009-10', '2010-11', '2011-12',
'2012-13', '2013-14', '2014-15', '2015-16', '1996-97', '1997-98',
'1998-99', '1999-00'], dtype=object)# 所属球队ID和队名,职业生涯都效力于湖人队
print(kobe['team_id'].unique())
print(kobe['team_name'].unique())[1610612747]
['Los Angeles Lakers']# 球队对阵及日期表
vsdf = pd.DataFrame({'matchup':kobe.matchup, 'opponent':kobe.opponent, 'game_date':kobe.game_date}) matchup opponent game_date
1 LAL @ POR POR 2000-10-31
2 LAL @ POR POR 2000-10-31
3 LAL @ POR POR 2000-10-31
4 LAL @ POR POR 2000-10-31
5 LAL @ POR POR 2000-10-31
6 LAL @ POR POR 2000-10-31
8 LAL @ POR POR 2000-10-31
9 LAL @ POR POR 2000-10-31
10 LAL @ POR POR 2000-10-31
11 LAL vs. UTA UTA 2000-11-01#plt.subplot(211) first is raw second Column
alpha = 0.02
plt.figure(figsize=(16,10))
# loc_x and loc_y 坐标位置
plt.subplot(121)
plt.scatter(kobe.loc_x, kobe.loc_y, color='#DA70D6', alpha=alpha)
plt.title('loc_x and loc_y')
# lat and lon 经纬度
plt.subplot(122)
plt.scatter(kobe.lon, kobe.lat, color='#FFD700', alpha=alpha)
plt.title('lat and lon')Text(0.5, 1.0, 'lat and lon')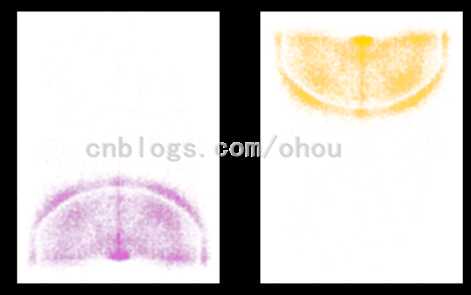
# 出手区域数据分布
gs = kobe.groupby('shot_zone_area')
print (kobe['shot_zone_area'].value_counts())
print (len(gs))
Center(C) 11289
Right Side Center(RC) 3981
Right Side(R) 3859
Left Side Center(LC) 3364
Left Side(L) 3132
Back Court(BC) 72
Name: shot_zone_area, dtype: int64
6# 根据不同区域绘制散点图
import matplotlib.cm as cm
plt.figure(figsize=(20,10))
def scatter_plot_by_category(feat):
alpha = 0.1
gs = kobe.groupby(feat)
cs = cm.rainbow(np.linspace(0, 1, len(gs)))
for g, c in zip(gs, cs):
plt.scatter(g[1].loc_x, g[1].loc_y, color=c, alpha=alpha)
# shot_zone_area
plt.subplot(131)
scatter_plot_by_category('shot_zone_area')
plt.title('shot_zone_area')
# shot_zone_basic
plt.subplot(132)
scatter_plot_by_category('shot_zone_basic')
plt.title('shot_zone_basic')
# shot_zone_range
plt.subplot(133)
scatter_plot_by_category('shot_zone_range')
plt.title('shot_zone_range')Text(0.5, 1.0, 'shot_zone_range')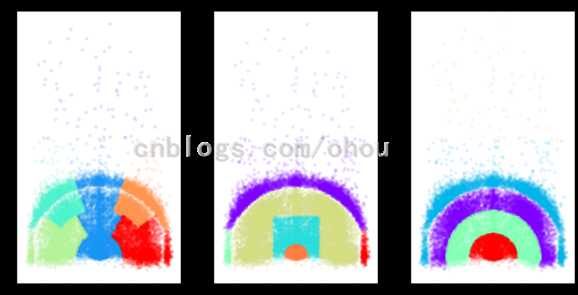
以下篮球场的绘制较为繁杂,参考了 B站素材
from matplotlib import pyplot as plt
from matplotlib.patches import Arc, Circle, Rectangle


def draw_ball_field(color='#20458C', lw=2):
    """
    绘制篮球场
    """
    # 新建一个大小为(6,6)的绘图窗口
    plt.figure(figsize=(12, 12))
    # 获得当前的Axes对象ax,进行绘图
    ax = plt.gca()

    # 对篮球场进行底色填充
    lines_outer_rec = Rectangle(xy=(-250, -47.5), width=500, height=470, linewidth=lw, color='#F0F0F0', fill=True)
    # 设置篮球场填充图层为最底层
    lines_outer_rec.set_zorder(0)
    # 将rec添加进ax
    ax.add_patch(lines_outer_rec)

    # 绘制篮筐,半径为7.5
    circle_ball = Circle(xy=(0, 0), radius=7.5, linewidth=lw, color=color, fill=False)
    # 将circle添加进ax
    ax.add_patch(circle_ball)

    # 绘制篮板,尺寸为(60,1)
    plate = Rectangle(xy=(-30, -7.5), width=60, height=-1, linewidth=lw, color=color, fill=False)
    # 将rec添加进ax
    ax.add_patch(plate)

    # 绘制2分区的外框线,尺寸为(160,190)
    outer_rec = Rectangle(xy=(-80, -47.5), width=160, height=190, linewidth=lw, color=color, fill=False)
    # 将rec添加进ax
    ax.add_patch(outer_rec)

    # 绘制2分区的内框线,尺寸为(120,190)
    inner_rec = Rectangle(xy=(-60, -47.5), width=120, height=190, linewidth=lw, color=color, fill=False)
    # 将rec添加进ax
    ax.add_patch(inner_rec)

    # 绘制罚球区域圆圈,半径为60
    circle_punish = Circle(xy=(0, 142.5), radius=60, linewidth=lw, color=color, fill=False)
    # 将circle添加进ax
    ax.add_patch(circle_punish)

    # 绘制三分线的左边线
    three_left_rec = Rectangle(xy=(-220, -47.5), width=0, height=140, linewidth=lw, color=color, fill=False)
    # 将rec添加进ax
    ax.add_patch(three_left_rec)

    # 绘制三分线的右边线
    three_right_rec = Rectangle(xy=(220, -47.5), width=0, height=140, linewidth=lw, color=color, fill=False)
    # 将rec添加进ax
    ax.add_patch(three_right_rec)

    # 绘制三分线的圆弧,圆心为(0,0),半径为238.66,起始角度为22.8,结束角度为157.2
    three_arc = Arc(xy=(0, 0), width=477.32, height=477.32, theta1=22.8, theta2=157.2, linewidth=lw, color=color, fill=False)
    # 将arc添加进ax
    ax.add_patch(three_arc)

    # 绘制中场处的外半圆,半径为60
    center_outer_arc = Arc(xy=(0, 422.5), width=120, height=120, theta1=180, theta2=0, linewidth=lw, color=color, fill=False)
    # 将arc添加进ax
    ax.add_patch(center_outer_arc)

    # 绘制中场处的内半圆,半径为20
    center_inner_arc = Arc(xy=(0, 422.5), width=40, height=40, theta1=180, theta2=0, linewidth=lw, color=color, fill=False)
    # 将arc添加进ax
    ax.add_patch(center_inner_arc)

    # 绘制篮球场外框线,尺寸为(500,470)
    lines_outer_rec = Rectangle(xy=(-250, -47.5), width=500, height=470, linewidth=lw, color=color, fill=False)
    # 将rec添加进ax
    ax.add_patch(lines_outer_rec)

    return ax


axs = draw_ball_field(color='#20458C', lw=2)

# 设置坐标轴范围
axs.set_xlim(-250, 250)
axs.set_ylim(422.5, -47.5)
# 消除坐标轴刻度
axs.set_xticks([])
axs.set_yticks([])
# 添加备注信息
# plt.annotate('By ohou', xy=(100, 160), xytext=(178, 418))
made = kobe[kobe['shot_made_flag'] == 1]
miss = kobe[kobe['shot_made_flag'] == 0]
# 绘制散点图
axs.scatter(x=miss['loc_x'], y=miss['loc_y'], s=20, marker='x', color='orange')
axs.scatter(x=made['loc_x'], y=made['loc_y'], s=20, marker='o', edgecolors='#3A7711', color="#6B8E23", linewidths=2)

plt.show()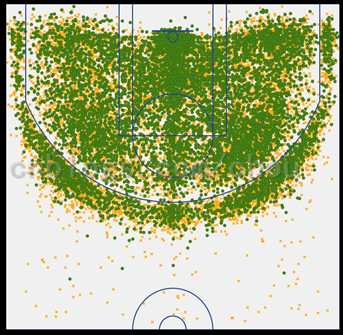
未完待续……
原文:https://www.cnblogs.com/ohou/p/12357283.html