根據 Promtheus 上的 Exporters and Integrations 頁面 所載,Prometheus 有釋出給 Elasticsearch 所用的 exporter ,也就是 elasticsearch_exporter 。
本文即是根據 elasticsearch_exporter 上的指示,主要介绍如何使用Grafana和Prometheus以及elasticsearch_exporter对Elasticsearch性能进行监控。
下载地址:https://github.com/justwatchcom/elasticsearch_exporter/releases
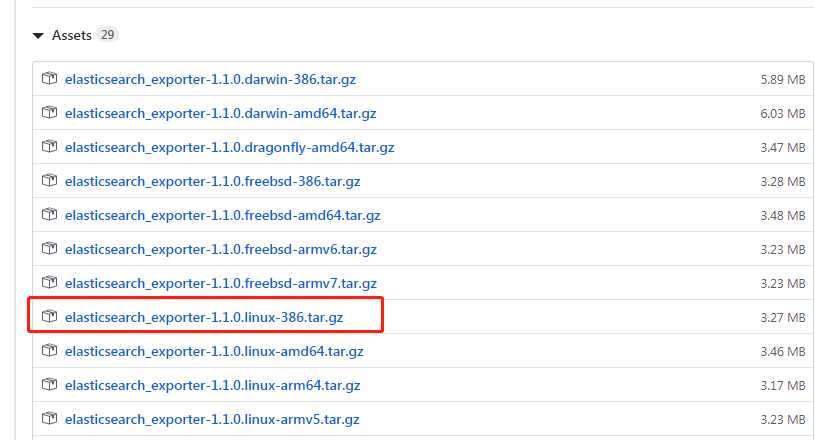
上传elasticsearch_exporter-1.1.0.linux-amd64.tar.gz安装包并解压到/usr/local目录
tar -xvf elasticsearch_exporter-1.1.0.linux-amd64.tar.gz
cd elasticsearch_exporter-1.1.0.linux-amd64/
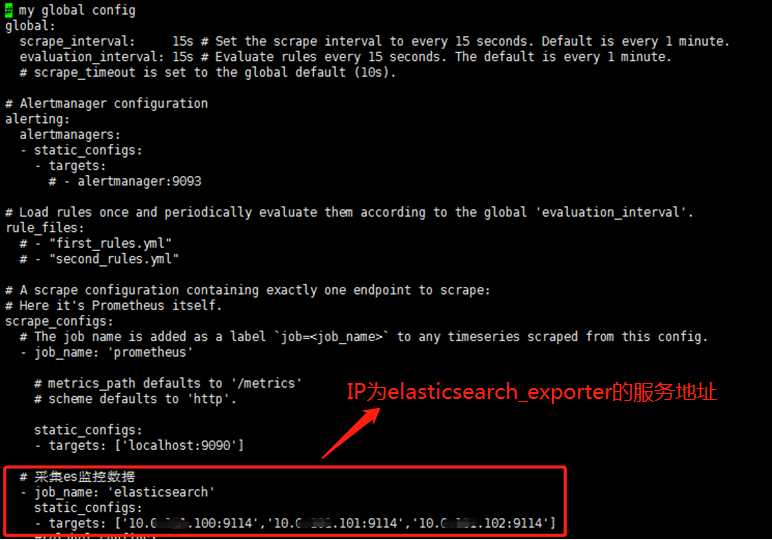
nohup ./elasticsearch_exporter --es.uri http://10.0.101.100:9200 &
注:--es.uri 指定的是es的服务地址。
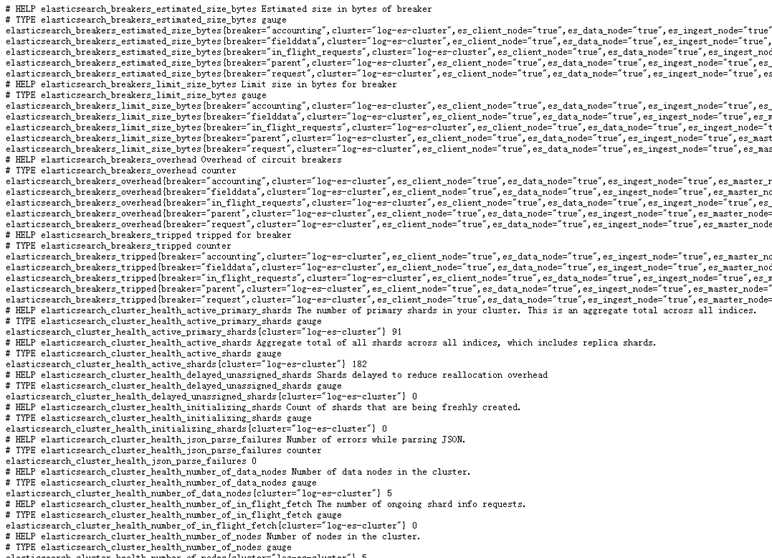
tail -1000f nohup.out

修改prometheus组件的prometheus.yml加入elasticsearch节点:
保存以后重启Prometheus,查看targets:
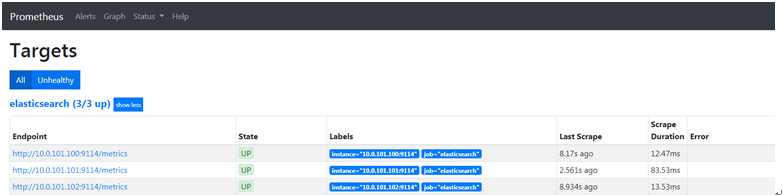
注:State=UP,说明成功
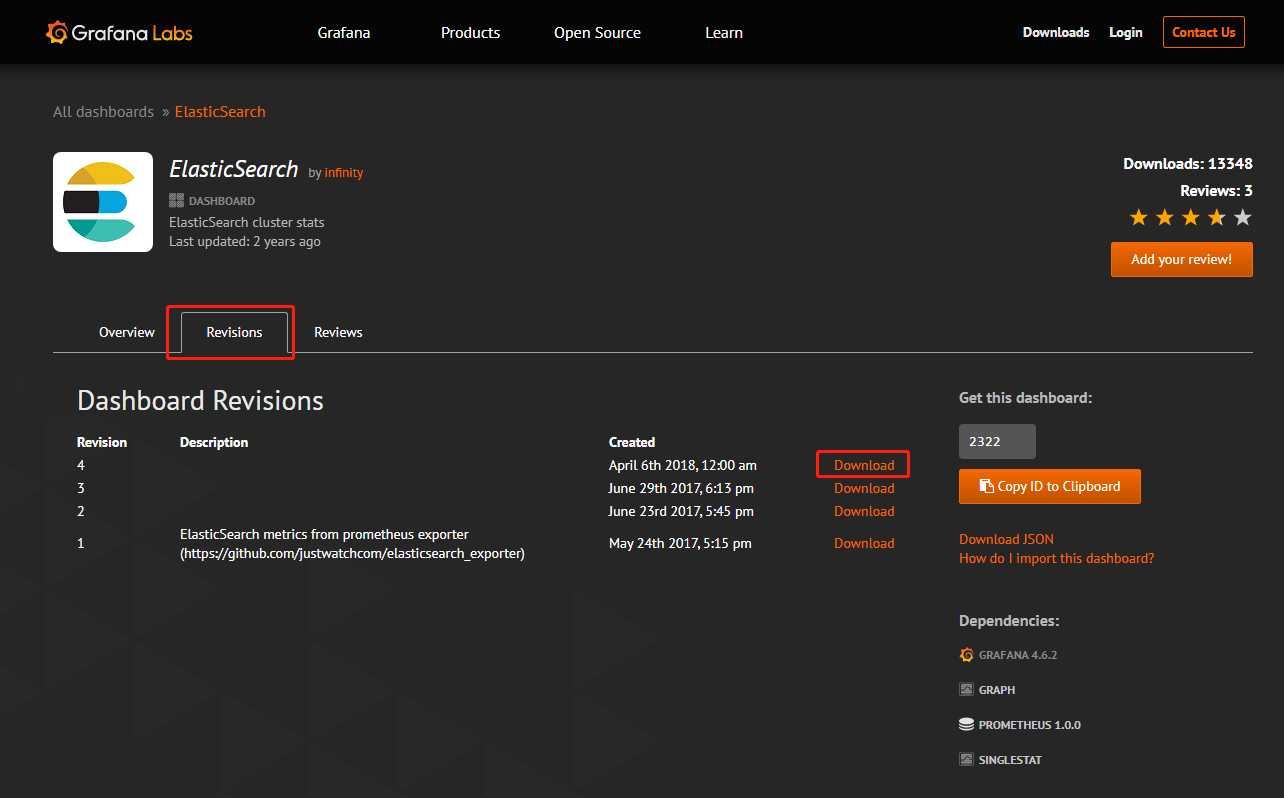
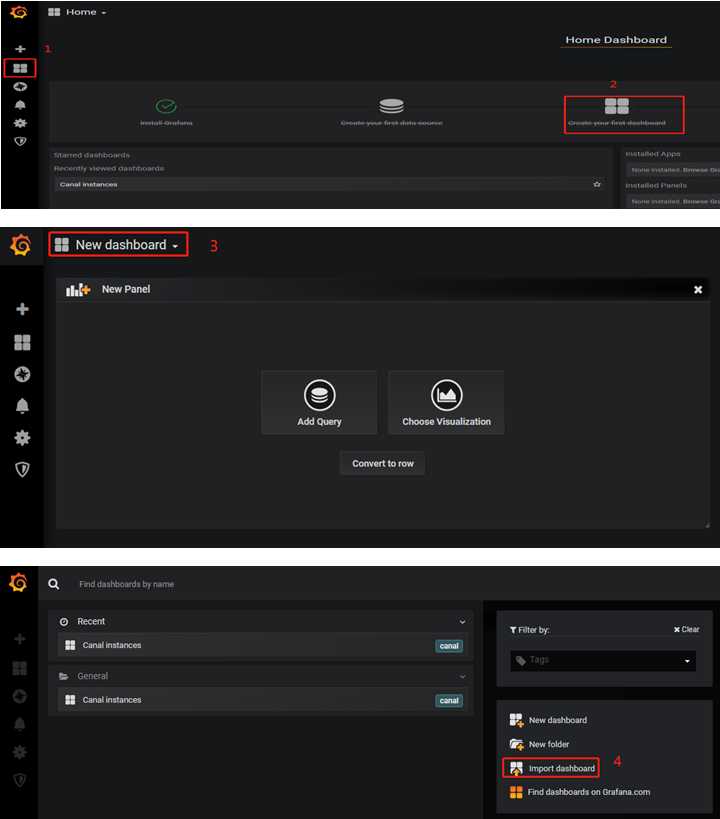
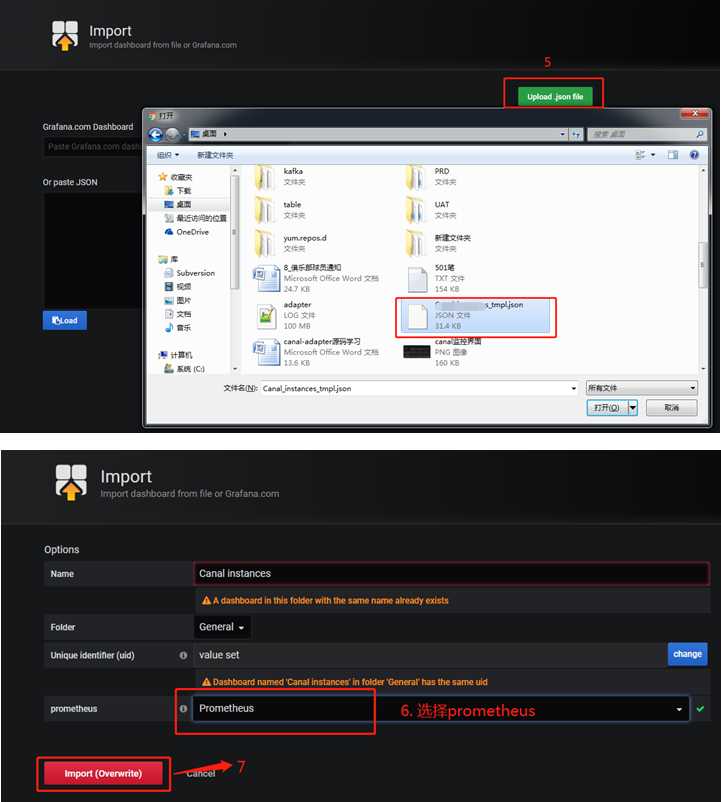
下载地址:https://grafana.com/grafana/dashboards/2322
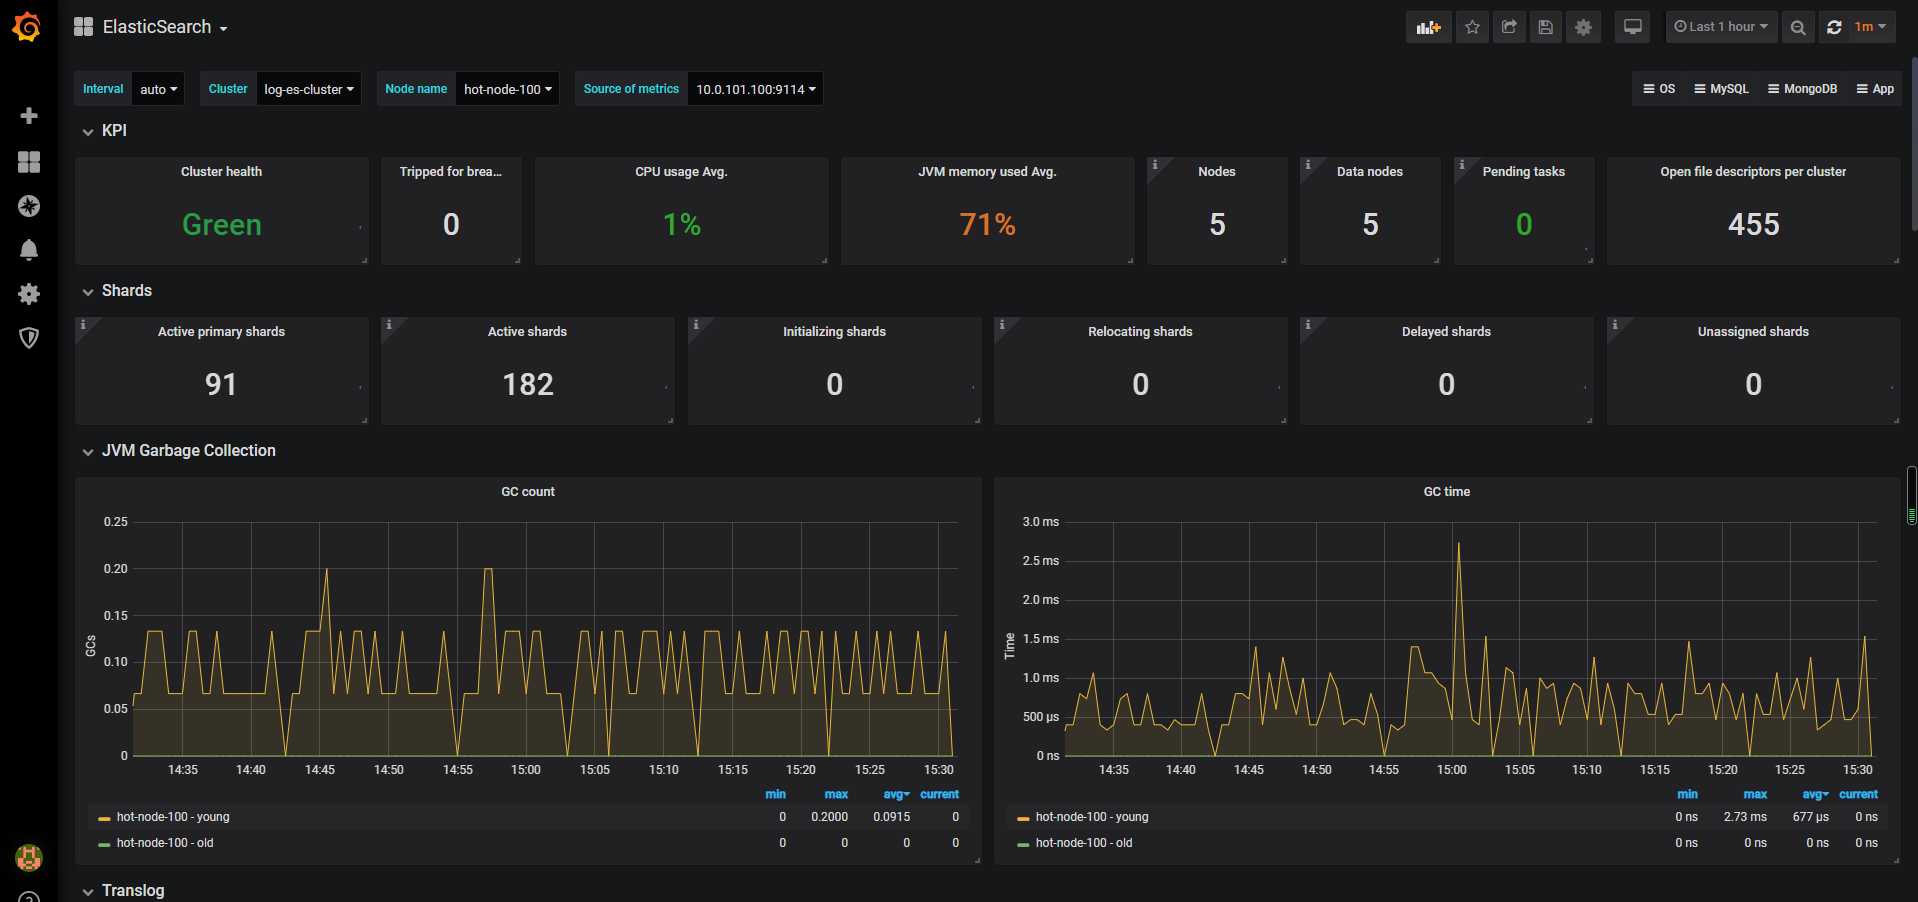
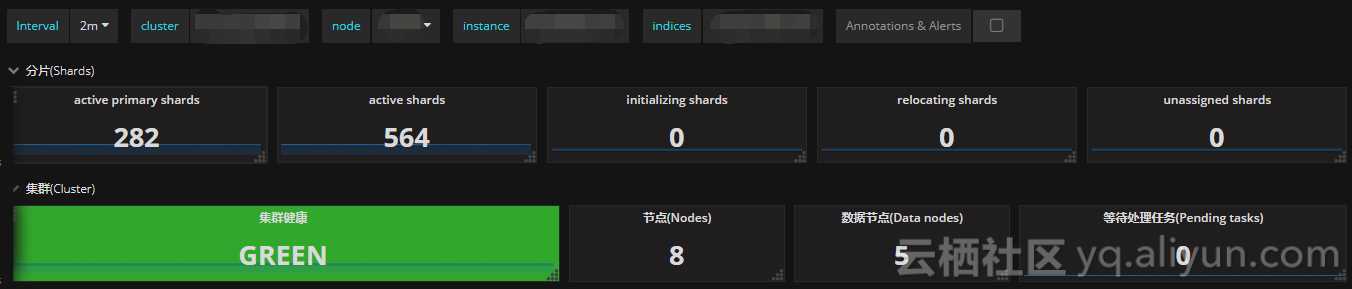
通过cluster healthAPI可以获取集群的健康状况,可以把集群的健康状态当做是集群平稳运行的重要信号,一旦状态发生变化则需要引起重视;API返回的一些重要参数指标及对应的prometheus监控项如下:
| 返回参数 | 备注 | metric name |
|---|---|---|
| status | 集群状态,green( 所有的主分片和副本分片都正常运行)、yellow(所有的主分片都正常运行,但不是所有的副本分片都正常运行)red(有主分片没能正常运行) | elasticsearch_cluster_health_status |
| number_of_nodes/number_of_data_nodes | 集群节点数/数据节点数 | elasticsearch_cluster_health_number_of_nodes/data_nodes |
| active_primary_shards | 活跃的主分片总数 | elasticsearch_cluster_health_active_primary_shards |
| active_shards | 活跃的分片总数(包括复制分片) | elasticsearch_cluster_health_active_shards |
| relocating_shards | 当前节点正在迁移到其他节点的分片数量,通常为0,集群中有节点新加入或者退出时该值会增加 | elasticsearch_cluster_health_relocating_shards |
| initializing_shards | 正在初始化的分片 | elasticsearch_cluster_health_initializing_shards |
| unassigned_shards | 未分配的分片数,通常为0,当有节点的副本分片丢失该值会增加 | elasticsearch_cluster_health_unassigned_shards |
| number_of_pending_tasks | 只有主节点能处理集群级元数据的更改(创建索引,更新映射,分配分片等),通过pending-tasks API可以查看队列中等待的任务,绝大部分情况下元数据更改的队列基本上保持为零 |
elasticsearch_cluster_health_number_of_pending_tasks |
依据上述监控项,配置集群状态Singlestat面板,健康状态一目了然:
| metric name | description |
|---|---|
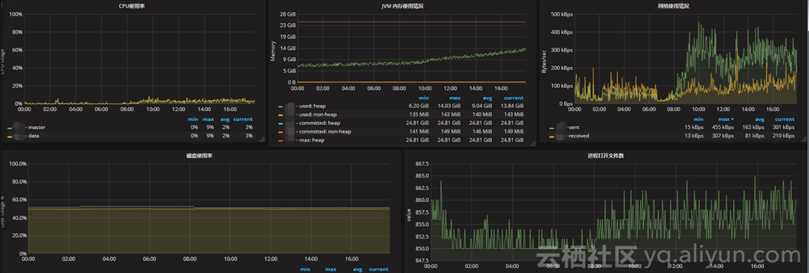
| elasticsearch_process_cpu_percent | Percent CPU used by process CPU使用率 |
| elasticsearch_filesystem_data_free_bytes | Free space on block device in bytes 磁盘可用空间 |
| elasticsearch_process_open_files_count | Open file descriptors ES进程打开的文件描述符 |
| elasticsearch_transport_rx_packets_total | Count of packets receivedES节点之间网络入流量 |
| elasticsearch_transport_tx_packets_total | Count of packets sentES节点之间网络出流量 |
如果CPU使用率持续增长,通常是由于大量的搜索或索引工作造成的负载。可能需要添加更多的节点来重新分配负载。
文件描述符用于节点间的通信、客户端连接和文件操作。如果打开的文件描述符达到系统的限制(一般Linux运行每个进程有1024个文件描述符,生产环境建议调大65535),新的连接和文件操作将不可用,直到有旧的被关闭。
如果ES集群是写负载型,建议使用SSD盘,需要重点关注磁盘空间使用情况。当segment被创建、查询和合并时,Elasticsearch会进行大量的磁盘读写操作。
节点之间的通信是衡量群集是否平衡的关键指标之一,可以通过发送和接收的字节速率,来查看集群的网络正在接收多少流量。
| metric name | description |
|---|---|
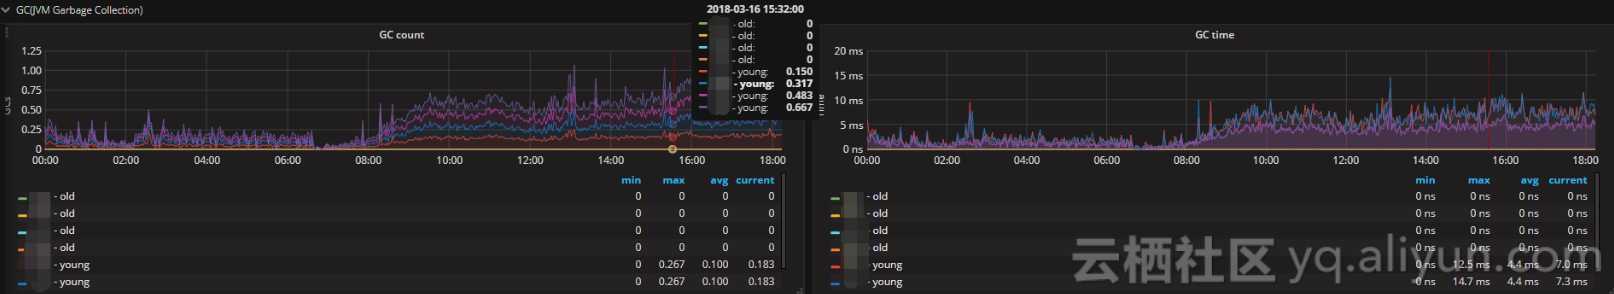
| elasticsearch_jvm_gc_collection_seconds_count | Count of JVM GC runs垃圾搜集数 |
| elasticsearch_jvm_gc_collection_seconds_sum | GC run time in seconds垃圾回收时间 |
| elasticsearch_jvm_memory_committed_bytes | JVM memory currently committed by area最大使用内存限制 |
| elasticsearch_jvm_memory_used_bytes | JVM memory currently used by area 内存使用量 |
主要关注JVM Heap 占用的内存以及JVM GC 所占的时间比例,定位是否有 GC 问题。Elasticsearch依靠垃圾回收来释放堆栈内存,默认当JVM堆栈使用率达到75%的时候启动垃圾回收,添加堆栈设置告警可以判断当前垃圾回收的速度是否比产生速度快,若不能满足需求,可以调整堆栈大小或者增加节点。
| metric name | description |
|---|---|
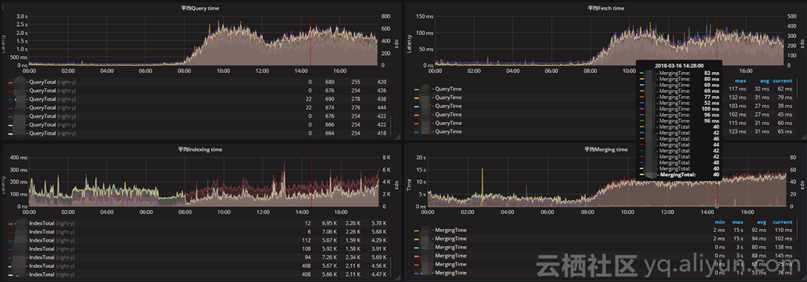
| elasticsearch_indices_search_query_total | query总数 |
| elsticsearch_indices_search_query_time_seconds | query时间 |
| elasticsearch_indices_search_fetch_total | fetch总数 |
| elasticsearch_indices_search_fetch_time_seconds | fetch时间 |
| metric name | description |
|---|---|
| elasticsearch_indices_indexing_index_total | Total index calls索引index数 |
| elasticsearch_indices_indexing_index_time_seconds_total | Cumulative index time in seconds累计index时间 |
| elasticsearch_indices_refresh_total | Total time spent refreshing in second refresh时间 |
| elasticsearch_indices_refresh_time_seconds_total | Total refreshess refresh数 |
| elasticsearch_indices_flush_total | Total flushes flush数 |
| elasticsearch_indices_flush_time_seconds | Cumulative flush time in seconds累计flush时间 |
将时间和操作数画在同一张图上,左边y轴显示时间,右边y轴显示对应操作计数,ops/time查看平均操作耗时判断性能是否异常。通过计算获取平均索引延迟,如果延迟不断增大,可能是一次性bulk了太多的文档。
Elasticsearch通过flush操作将数据持久化到磁盘,如果flush延迟不断增大,可能是磁盘IO能力不足,如果持续下去最终将导致无法索引数据。
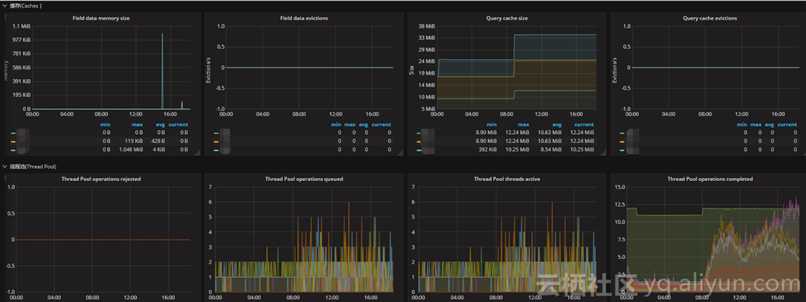
| metric name | description |
|---|---|
| elasticsearch_thread_pool_queue_count | Thread Pool operations queued 线程池中排队的线程数 |
| elasticsearch_thread_pool_rejected_count | Thread Pool operations rejected 线程池中被拒绝的线程数 |
| elasticsearch_indices_fielddata_memory_size_bytes | Field data cache memory usage in bytes fielddata缓存的大小 |
| elasticsearch_indices_fielddata_evictions | Evictions from filter cache fielddata缓存的驱逐次数 |
| elasticsearch_indices_filter_cache_memory_size_bytes | Filter cache memory usage in bytes 过滤器高速缓存的大小 |
| elasticsearch_indices_filter_cache_evictions | Evictions from filter cache 过滤器缓存的驱逐次数 |
| elasticsearch_cluster_health_number_of_pending_tasks | Cluster level changes which have not yet been executed 待处理任务数 |
| elasticsearch_indices_get_missing_total | Total get missing 丢失文件的请求数 |
| elasticsearch_indices_get_missing_time_seconds | Total time of get missing in seconds 文档丢失的请求时间 |
通过采集以上指标配置视图,Elasticsearch节点使用线程池来管理线程对内存和CPU使用。可以通过请求队列和请求被拒绝的情况,来确定节点是否够用。
每个Elasticsearch节点都维护着很多类型的线程池。一般来讲,最重要的几个线程池是搜索(search),索引(index),合并(merger)和批处理(bulk)。
每个线程池队列的大小代表着当前节点有多少请求正在等待服务。一旦线程池达到最大队列大小(不同类型的线程池的默认值不一样),后面的请求都会被线程池拒绝。
参考:
https://shenshengkun.github.io/posts/550bdf86.html
https://yq.aliyun.com/articles/548354
Prometheus + Grafana(八)系统监控之Elasticsearch
原文:https://www.cnblogs.com/caoweixiong/p/12156590.html