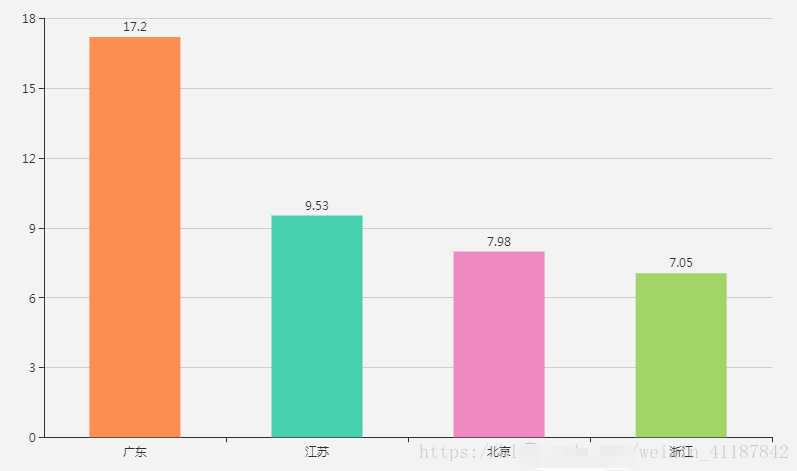
var option = {
    //标题栏
    title: {
      text: ‘客户总体分析‘,
      bottom: ‘0‘,
      left: ‘35%‘
    },
    //选中时弹出的悬浮框
    tooltip: {
      trigger: ‘axis‘, //‘item‘,数据项图形触发,主要在散点图,饼图等无类目轴的图表中使用。‘axis‘,坐标轴触发,主要在柱状图,折线图等会使用类目轴的图表中使用。
      axisPointer: { // 坐标轴指示器,坐标轴触发有效
        type: ‘shadow‘, // 默认为直线,可选为:‘line‘ | ‘shadow‘
      },
      formatter: ‘{b}: {c}%‘, //需要展示的数据,b为名称,c为数值
      confine: true //是否将悬浮框限定在特定区域
    },
    //绘图网格
    grid: {
      left: ‘10%‘, //距离左边界
      right: ‘10%‘,
      bottom: ‘10%‘,
      top: ‘20%‘,
      containLabel: true //为true是可防止溢出
    },
    // grid 中的 x 轴
    xAxis: [{
      type: ‘category‘, //‘value‘ 数值轴,‘category‘ 类目轴,‘time‘ 时间轴,‘log‘ 对数轴
      //name:‘这是x轴‘,//坐标轴名称
      //show:true,//是否显示x轴
      //position:‘bottom‘,//x轴的位置
      //boundaryGap:false,//数据点和标签会在两个刻度的中间
      //min:‘‘,//最小值
      //max:‘‘,//最大值
      data: [‘广东‘, ‘江苏‘, ‘北京‘, ‘浙江‘], //x轴的类目
      axisTick: { //刻度
        show: true, //展示
        //alignWithLabel: false,boundaryGap 为 true 的时候有效,可以保证刻度线和标签对齐
        //interval: ‘auto‘,坐标轴刻度的显示间隔
        //inside: false,坐标轴刻度是否朝内,默认朝外
        //length: 5,坐标轴刻度的长度。
        lineStyle: { //刻度样式
          //color: ...,刻度线的颜色
          //width: 1,坐标轴刻度线宽。
          //type: ‘solid‘,坐标轴刻度线的类型。‘solid‘‘dashed‘‘dotted‘
          //shadowBlur: ...,图形阴影的模糊大小。该属性配合 shadowColor,shadowOffsetX, shadowOffsetY 一起设置图形的阴影效果。
          //shadowColor: ...,
          //shadowOffsetX: 0,
          //shadowOffsetY: 0,
          //opacity: ...图形透明度
        }
      },
      axisLine: {
        lineStyle: { //这里可以调节一些坐标轴线的样式
          opacity: 1
        }
      },
      axisLabel: { //坐标轴标签的设置
        show: true,
        //interval: ‘auto‘,坐标轴刻度标签的显示间隔
        //inside: false,刻度标签是否朝内,默认朝外。
        //rotate: 0,旋转的角度从 -90 度到 90 度。
        //margin: 8,刻度标签与轴线之间的距离。
        //formatter: null,刻度标签的内容格式器,支持字符串模板和回调函数两种形式。
        //showMinLabel: null,是否显示最小 tick 的 label。可取值 true, false, null。
        //showMaxLabel: null,是否显示最大 tick 的 label。可取值 true, false, null。
        //color: ...,刻度标签文字的颜色,
        //fontStyle: ‘normal‘,文字字体的风格
        //fontWeight: normal,
        //fontFamily: ‘sans-serif‘,
        //fontSize: 12,
        //align: ...,
        //verticalAlign: ...,
        //lineHeight: ...,
        //backgroundColor: ‘transparent‘,
        //borderColor: ‘transparent‘,
        //borderWidth: 0,
        //borderRadius: 0,
        //padding: 0,
        //shadowColor: ‘transparent‘,
        //shadowBlur: 0,
        //shadowOffsetX: 0,
        //shadowOffsetY: 0,
        //width: ...,
        //height: ...,
      }
    }],
    yAxis: [{
      type: ‘value‘
    }],
    series: [{
      type: ‘bar‘,
      data: [17.2, 9.53, 7.98, 7.05],
      itemStyle: {
        normal: {
          color: function (params) {
            //首先定义一个数组
            var colorList = [
              ‘#fc8d52‘, ‘#48cfae‘, ‘#ec87bf‘, ‘#a0d468‘
            ];
            return colorList[params.dataIndex]
          },
          lineStyle: {
            color: ‘#ff6300‘
          }
        }
      },
      label: { //柱状图常显示标签
        normal: {
          show: true,
          position: ‘top‘,
          color: ‘#333‘,
          formatter: function (params) { //通过“formatter”实现内容自定义;
            for (var i = 0, l = option.xAxis[0].data.length; i < l; i++) {
              if (option.xAxis[0].data[i] == params.name) {
                var val1 = params.value || 0;
                return ‘{color1|‘ + option.xAxis[0].data[i] + ‘}:{color2|‘ + val1 + ‘}‘;
              }
            }
          },
          rich: { //通过“rich”项控制内容样式;
            color1: {
              color: ‘#f7ba0e‘
            },
            color2: {
              color: ‘#42a1fe‘
            }
          },
          textStyle: {
            color: ‘#333‘
          }
        }
      },
      barWidth: ‘50%‘
    }],

  }
结果:
原文:https://www.cnblogs.com/linfblog/p/12150939.html