目录
当前的学习也是调参的过程
# Print the last item of gdp_cap and life_exp
print(gdp_cap)
print(life_exp)

# Make a line plot, gdp_cap on the x-axis, life_exp on the y-axis
plt.plot(gdp_cap,life_exp)

# Display the plot
plt.show()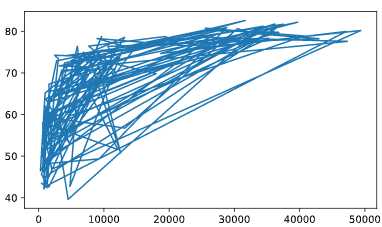
# Change the line plot below to a scatter plot
plt.plot(gdp_cap, life_exp)

# Put the x-axis on a logarithmic scale
plt.scatter(gdp_cap, life_exp)
plt.xscale('log')
# Show plot
plt.show()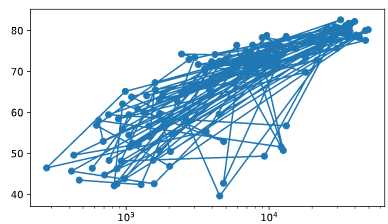
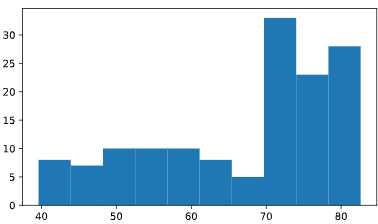
# Create histogram of life_exp data
plt.hist(life_exp)

# Display histogram
plt.show()

# Build histogram with 5 bins
plt.hist(life_exp,bins=5)
# Show and clean up plot
plt.show()
plt.clf()
自定义绘图
# Basic scatter plot, log scale
plt.scatter(gdp_cap, life_exp)
plt.xscale('log')
# Strings
xlab = 'GDP per Capita [in USD]'
ylab = 'Life Expectancy [in years]'
title = 'World Development in 2007'
# Add axis labels
plt.xlabel(xlab )
plt.ylabel(ylab)
# Add title
plt.title(title)
# After customizing, display the plot
plt.show()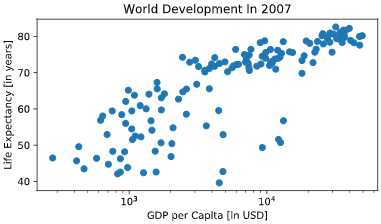
# Scatter plot
plt.scatter(gdp_cap, life_exp)
# Previous customizations
plt.xscale('log')
plt.xlabel('GDP per Capita [in USD]')
plt.ylabel('Life Expectancy [in years]')
plt.title('World Development in 2007')
# Definition of tick_val and tick_lab
tick_val = [1000, 10000, 100000]
tick_lab = ['1k', '10k', '100k']
# Adapt the ticks on the x-axis
plt.xticks(tick_val, tick_lab)
# After customizing, display the plot
plt.show()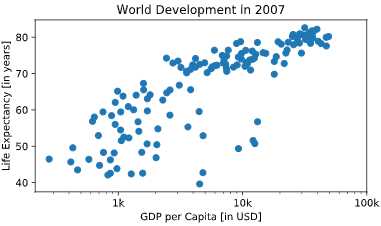
# Specify c and alpha inside plt.scatter()
plt.scatter(x = gdp_cap, y = life_exp, s = np.array(pop) * 2,c=col,alpha=0.8)

# Previous customizations
plt.xscale('log')
plt.xlabel('GDP per Capita [in USD]')
plt.ylabel('Life Expectancy [in years]')
plt.title('World Development in 2007')
plt.xticks([1000,10000,100000], ['1k','10k','100k'])
# Show the plot
plt.show()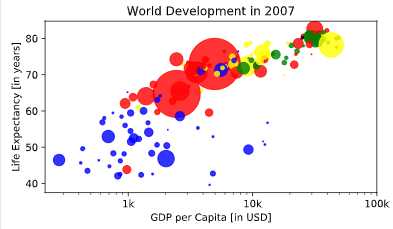
# Scatter plot
plt.scatter(x = gdp_cap, y = life_exp, s = np.array(pop) * 2, c = col, alpha = 0.8)

# Previous customizations
plt.xscale('log')
plt.xlabel('GDP per Capita [in USD]')
plt.ylabel('Life Expectancy [in years]')
plt.title('World Development in 2007')
plt.xticks([1000,10000,100000], ['1k','10k','100k'])
# Additional customizations
plt.text(1550, 71, 'India')
plt.text(5700, 80, 'China')
# Add grid() call
plt.grid(True)
# Show the plot
plt.show()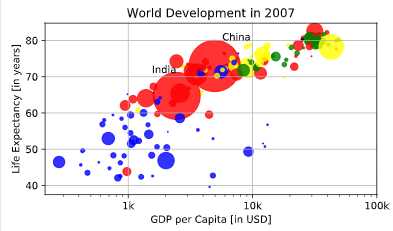
# Definition of countries and capital
countries = ['spain', 'france', 'germany', 'norway']
capitals = ['madrid', 'paris', 'berlin', 'oslo']

# Get index of 'germany': ind_ger
ind_ger=countries.index('germany')

# Use ind_ger to print out capital of Germany
print(capitals[ind_ger])# Definition of countries and capital
countries = ['spain', 'france', 'germany', 'norway']
capitals = ['madrid', 'paris', 'berlin', 'oslo']
# From string in countries and capitals, create dictionary europe
europe = { 'spain':'madrid','france':'paris', 'germany':'berlin', 'norway':'oslo' }
# Print europe
print(europe)可以直接用[]来取出key所对应的值
# Definition of dictionary
europe = {'spain':'madrid', 'france':'paris', 'germany':'berlin', 'norway':'oslo' }

# Print out the keys in europe
#直接调用keys方法
print(europe.keys())

# Print out value that belongs to key 'norway'
print(europe['norway'])# Definition of dictionary
europe = {'spain':'madrid', 'france':'paris', 'germany':'berlin', 'norway':'oslo' }
# Add italy to europe
europe['italy']='rome'
# Print out italy in europe
print('italy' in europe)
# Add poland to europe
europe['poland']='warsaw'
# Print europe
print(europe)使用del删除
# Definition of dictionary
europe = {'spain':'madrid', 'france':'paris', 'germany':'bonn',
          'norway':'oslo', 'italy':'rome', 'poland':'warsaw',
          'australia':'vienna' }
# Update capital of germany
europe['germany']='berlin'
# Remove australia
del(europe['australia'])
# Print europe
print(europe)# Dictionary of dictionaries
europe = { 'spain': { 'capital':'madrid', 'population':46.77 },
'france': { 'capital':'paris', 'population':66.03 },
'germany': { 'capital':'berlin', 'population':80.62 },
'norway': { 'capital':'oslo', 'population':5.084 } }
# Print out the capital of France
print(europe['france']['capital'])
# Create sub-dictionary data
data = { 'capital':'rome', 'population':59.83 }
# Add data to europe under key 'italy'
europe['italy'] = data
# Print europe
print(europe)intermediate-python-for-data-science
原文:https://www.cnblogs.com/gaowenxingxing/p/12148690.html