
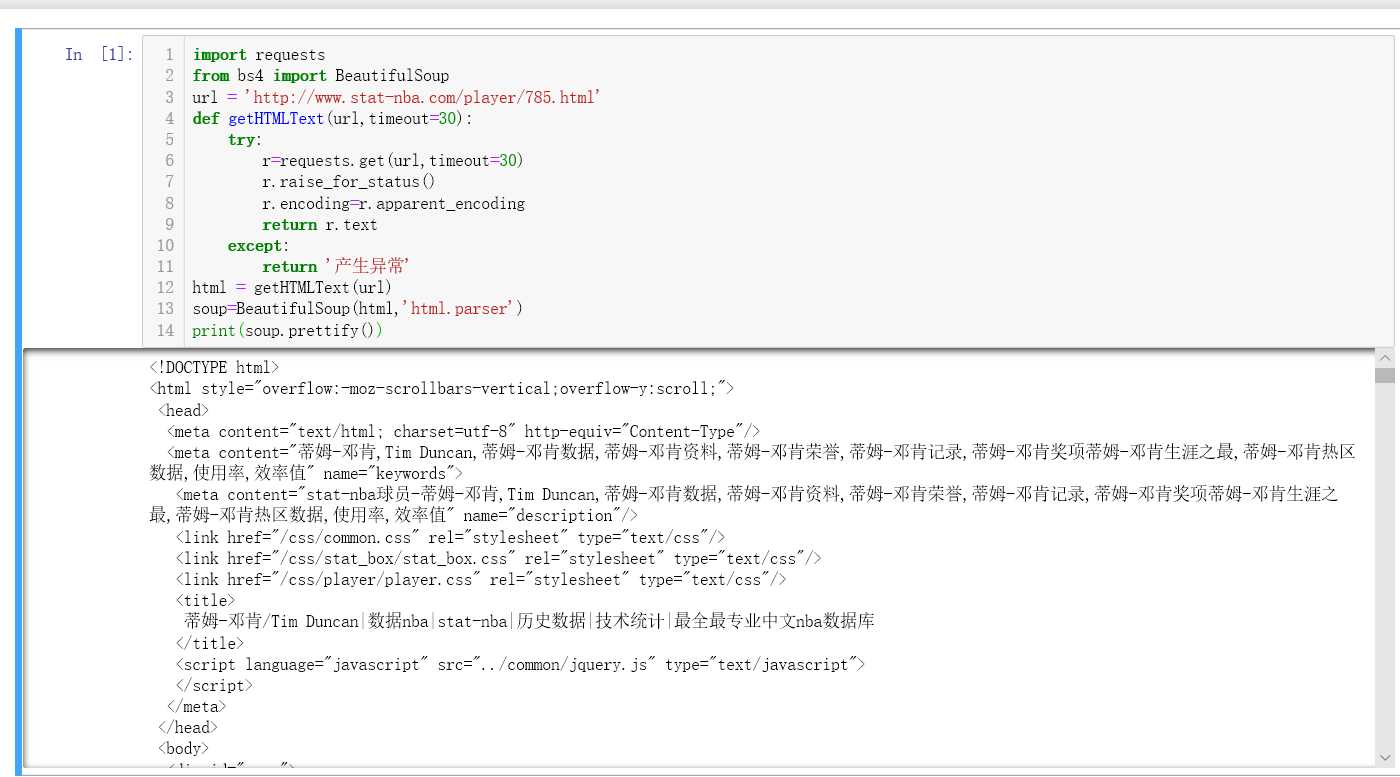
import requests
from bs4 import BeautifulSoup
url = ‘http://www.stat-nba.com/player/785.html‘
def getHTMLText(url,timeout=30):
    try:
        r=requests.get(url,timeout=30)
        r.raise_for_status()
        r.encoding=r.apparent_encoding
        return r.text
    except:
        return ‘产生异常‘
html = getHTMLText(url)
soup=BeautifulSoup(html,‘html.parser‘)
print(soup.prettify())
import requests
from bs4 import BeautifulSoup
import time
from xlwt import Workbook
def getNBAData(url):
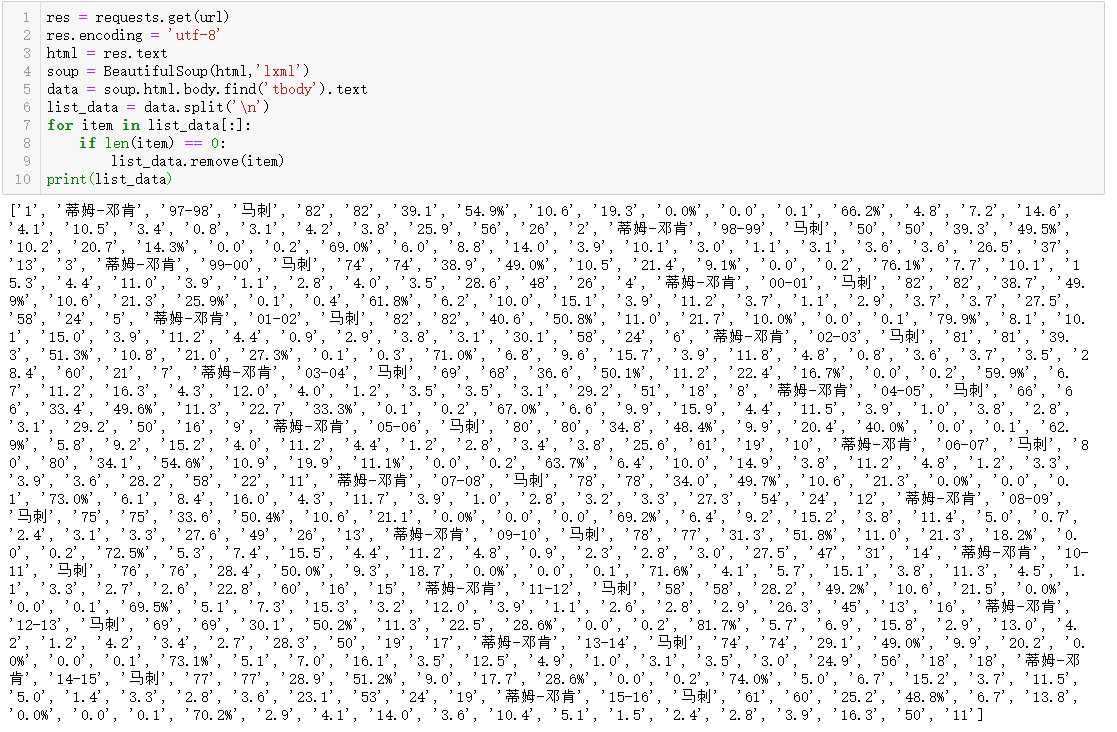
res = requests.get(url)
res.encoding = ‘utf-8‘
html = res.text
soup = BeautifulSoup(html,‘lxml‘)
data = soup.html.body.find(‘tbody‘).text
list_data = data.split(‘\n‘)
with open(‘nba_data.txt‘, ‘a‘,encoding=‘utf-8‘) as fp:
fp.write(data)
for item in list_data[:]:
if len(item) == 0:
list_data.remove(item)
return list_data
def saveDataToExcel(datasets, sheetname, filename):
book = Workbook()
sheet = book.add_sheet(sheetname)
sheet.write(0, 0, ‘序号‘)
sheet.write(0, 1, ‘球员‘)
sheet.write(0, 2, ‘赛季‘)
sheet.write(0, 3, ‘球队‘)
sheet.write(0, 4, ‘出场‘)
sheet.write(0, 5, ‘时间‘)
sheet.write(0, 6, ‘投篮‘)
sheet.write(0, 7, ‘命中‘)
sheet.write(0, 8, ‘出手‘)
sheet.write(0, 9, ‘三分‘)
sheet.write(0, 10, ‘命中‘)
sheet.write(0, 11, ‘出手‘)
sheet.write(0, 12, ‘罚球‘)
sheet.write(0, 13, ‘命中‘)
sheet.write(0, 14, ‘出手‘)
sheet.write(0, 15, ‘篮板‘)
sheet.write(0, 16, ‘前场‘)
sheet.write(0, 17, ‘后场‘)
sheet.write(0, 18, ‘助攻‘)
sheet.write(0, 19, ‘抢断‘)
sheet.write(0, 20, ‘盖帽‘)
sheet.write(0, 21, ‘失误‘)
sheet.write(0, 22, ‘犯规‘)
sheet.write(0, 23, ‘得分‘)
sheet.write(0, 24, ‘胜‘)
sheet.write(0, 25, ‘负‘)
num = 26
row_cnt = 0
data_cnt = 0
data_len = len(datasets)
while (data_cnt < data_len):
row_cnt += 1
for col in range(num):
sheet.write(row_cnt, col, datasets[data_cnt])
data_cnt += 1
book.save(filename)
if __name__ == "__main__":
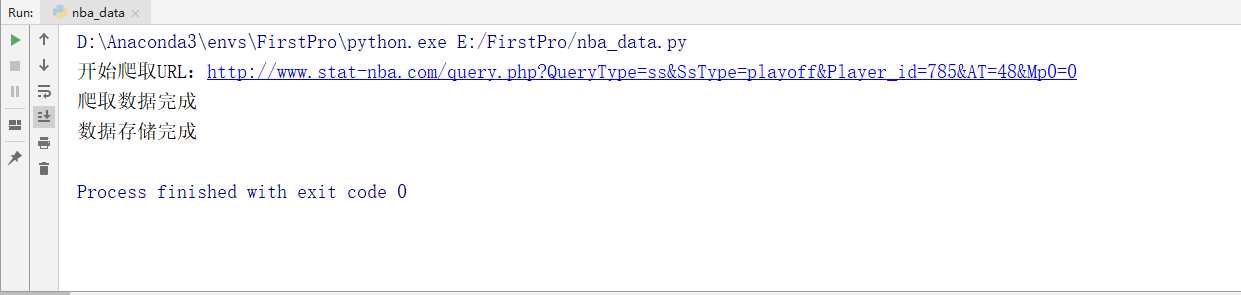
url = ‘http://www.stat-nba.com/query.php?QueryType=ss&SsType=playoff&Player_id=785&AT=48&Mp0=0‘
print(‘开始爬取URL:%s‘ % url)
datasets = getNBAData(url)
print(‘爬取数据完成‘)
sheetname = ‘nba normal data‘
str_time = time.strftime(‘%Y-%m-%d‘, time.localtime(time.time()))
filename = ‘nba_normal_data‘ + str_time + ‘.xls‘
saveDataToExcel(datasets, sheetname, filename)
print(‘数据存储完成‘)

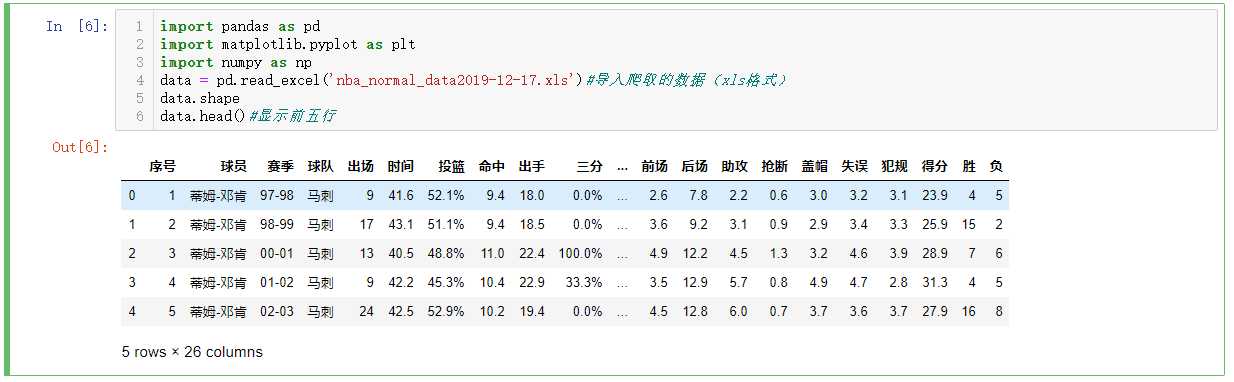
import pandas as pd
import matplotlib.pyplot as plt
import numpy as np
def main():
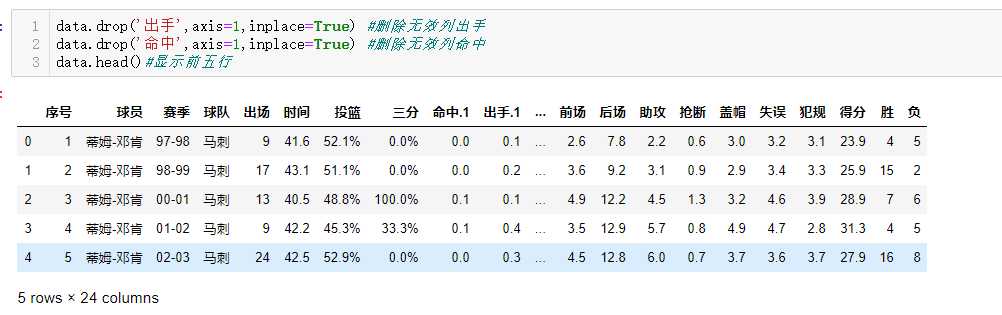
# 数据清洗
data.drop(‘出手‘,axis=1,inplace=True) #删除无效列出手
data.head()#显示前五行
data.drop(‘命中‘,axis=1,inplace=True) #删除无效列命中
data.head()#显示前五行
data.describe()
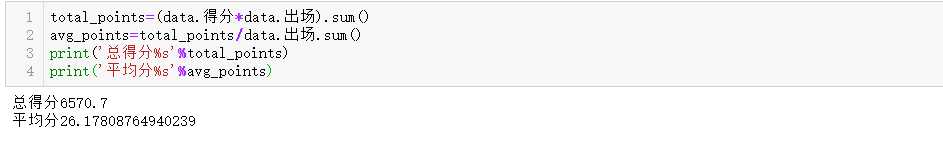
total_points=(data.得分*data.出场).sum()#总得分
avg_points=total_points/data.出场.sum()#平均分
print("邓肯总得分:%s" %round(total_points,1))
print("邓肯平均分:%s" %round(avg_points,1))
max_point=data.得分.max()
print(data[data.得分==max_point])#显示最高得分赛季
print(data.loc[data.得分>=30])#显示得分超过30分的赛季
# 最佳数据
max_data={‘point‘:data.得分.max(),‘rebounds‘:data.篮板.max(),‘assistants‘:data.助攻.max(),‘steals‘:data.抢断.max(),‘blocks‘:data.盖帽.max()}
best_data=pd.Series(max_data)
print(best_data)
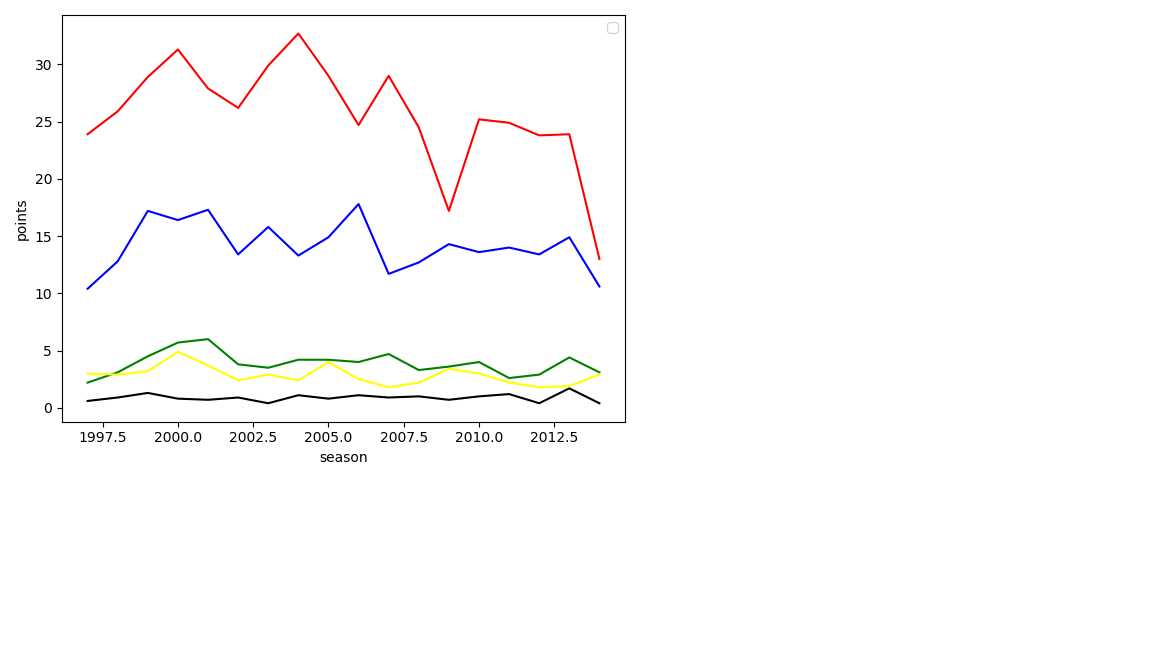
# 生成折线图
def Brokenline():
plt.figure()#绘制画板
x=np.array([x for x in range(1997,2015)])#x轴为年份
y1=data.得分#y1轴为得分
y2=data.篮板#y2轴为篮板
y3=data.助攻#y3轴为助攻
y4=data.抢断#y4轴为抢断
y5=data.盖帽#y5轴为盖帽
plt.xlabel(‘season‘)
plt.ylabel(‘points‘)
plt.plot(x,y1,‘red‘)
plt.plot(x,y2,‘blue‘)
plt.plot(x,y3,‘green‘)
plt.plot(x,y4,‘black‘)
plt.plot(x,y5,‘yellow‘)
plt.legend()
plt.show()
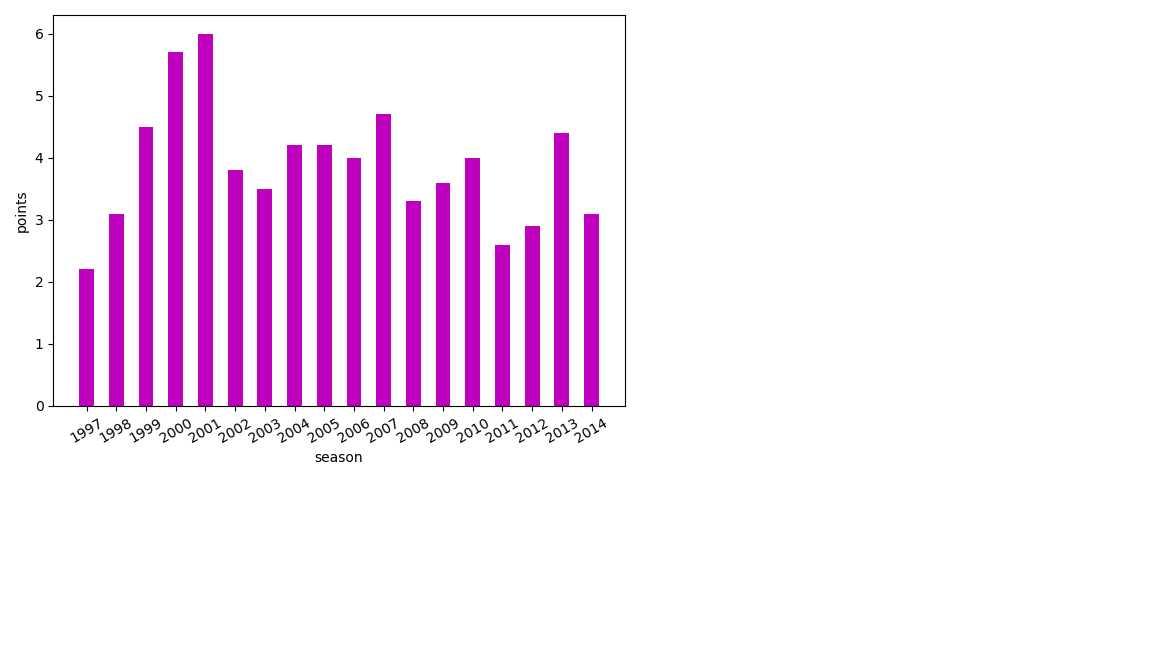
# 生成柱状图
def Histogram()
x=np.array([x for x in range(1997,2015)])
y=data.助攻
plt.xlabel(‘season‘)
plt.ylabel(‘points‘)
plt.bar(x,y,width=0.5,color=‘m‘)
plt.xticks(x,rotation=30)
ax=plt.gca()
x_lables=ax.xaxis
plt.show()
if __name__ == ‘__main__‘:
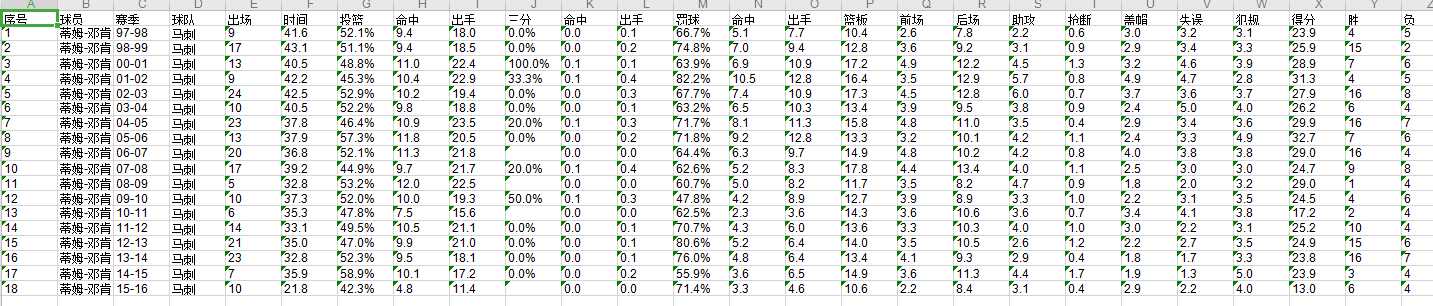
# 导入爬取的数据(xls格式)
data = pd.read_excel(‘nba_normal_data2019-12-17.xls‘)
main()
#Brokenline()
Histogram()
原文:https://www.cnblogs.com/cmbgood/p/12059891.html