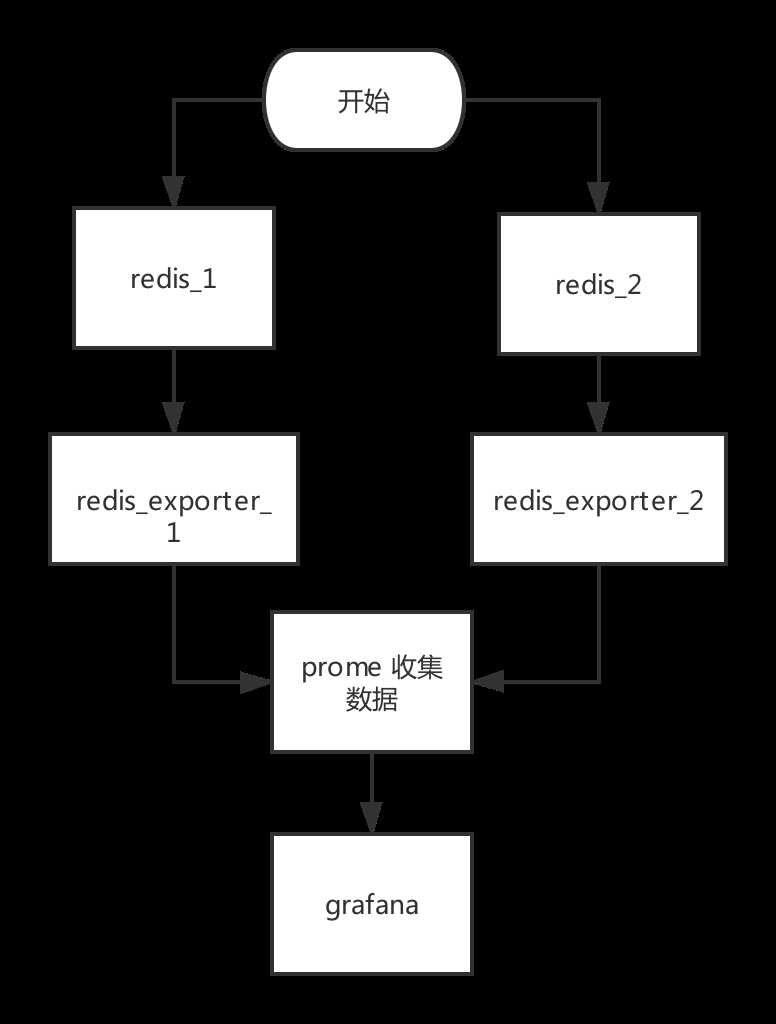
docker run -d --name redis1 redis
docker run -d --name redis2 redisdocker inspect (docker ps -a | grep redis | awk '{print $1}') | grep IPAddressdocker run -d --name redis_exporter_1 -p 9121:9121 oliver006/redis_exporter --redis.addr=172.17.0.2:6379
docker run -d --name redis_exporter_2 -p 9122:9121 oliver006/redis_exporter --redis.addr=172.17.0.3:6379global:
scrape_interval: 15s
evaluation_interval: 15s
# Attach these labels to any time series or alerts when communicating with
# external systems (federation, remote storage, Alertmanager).
external_labels:
monitor: "prometheus-stack-monitor"
# Load and evaluate rules in this file every 'evaluation_interval' seconds.
#rule_files:
# - "first.rules"
# - "second.rules"
scrape_configs:
# scrape Prometheus itself
- job_name: prometheus
scrape_interval: 10s
scrape_timeout: 5s
static_configs:
- targets: ["localhost:9090"]
# scrape Redis Enterprise
- job_name: redis-enterprise
scrape_interval: 3s
scrape_timeout: 3s
static_configs:
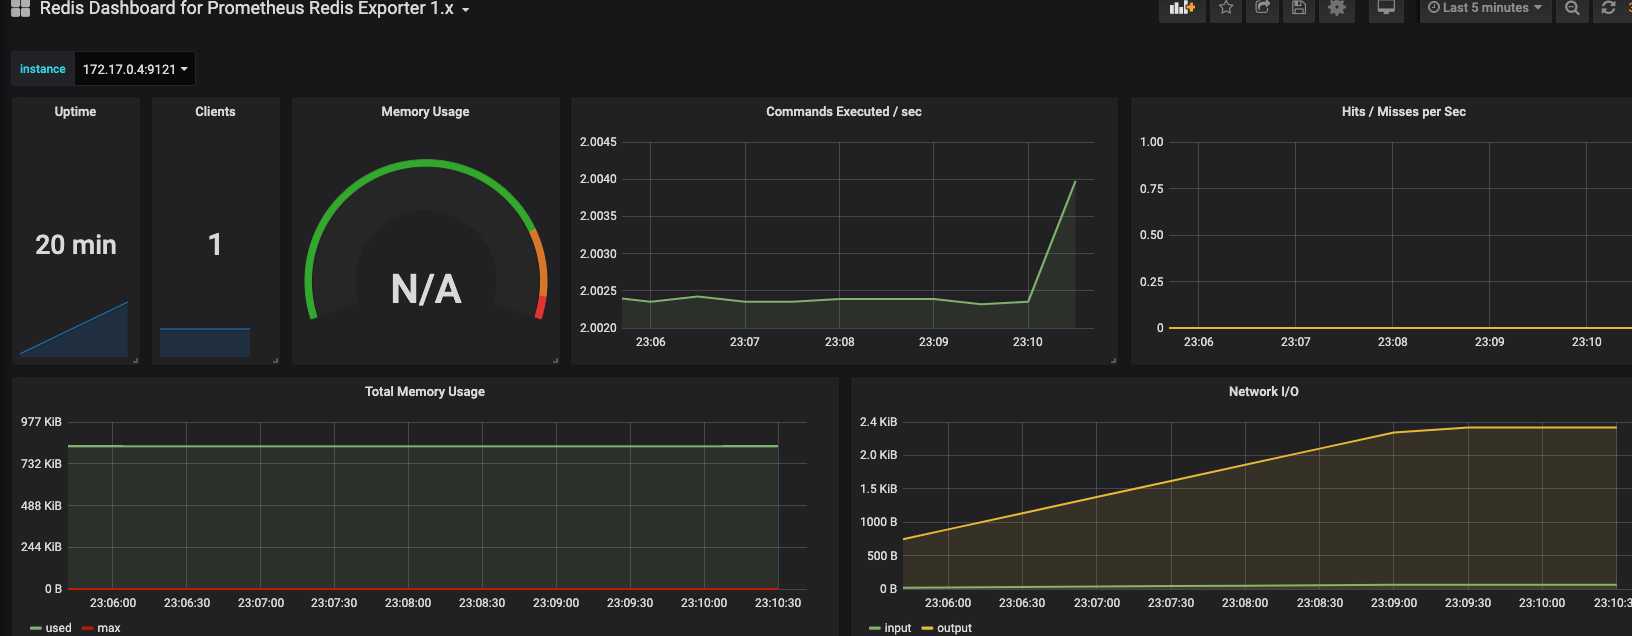
- targets: ['172.17.0.4:9121','172.17.0.7:9121']targets中为redis_exporter的地址和端口号,多个逗号分隔
docker run -d --name prome -p 9090:9090 -v /prometheus/prometheus.yml:/etc/prometheus/prometheus.yml prom/prometheusprometheus配置文件需要使用绝对位置
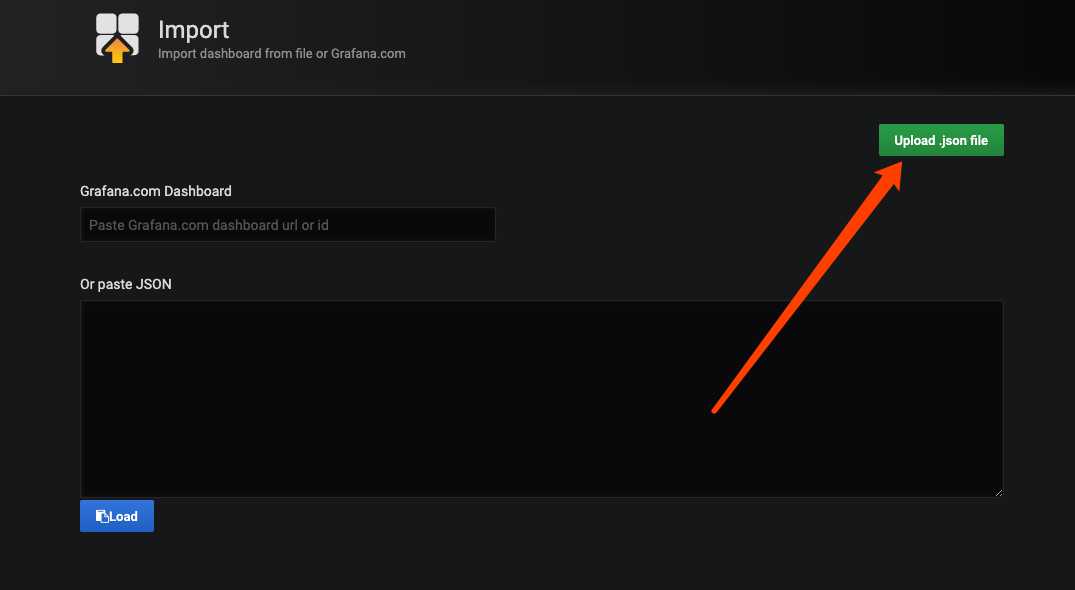
docker run -d --name=grafana -p 3000:3000 grafana/grafana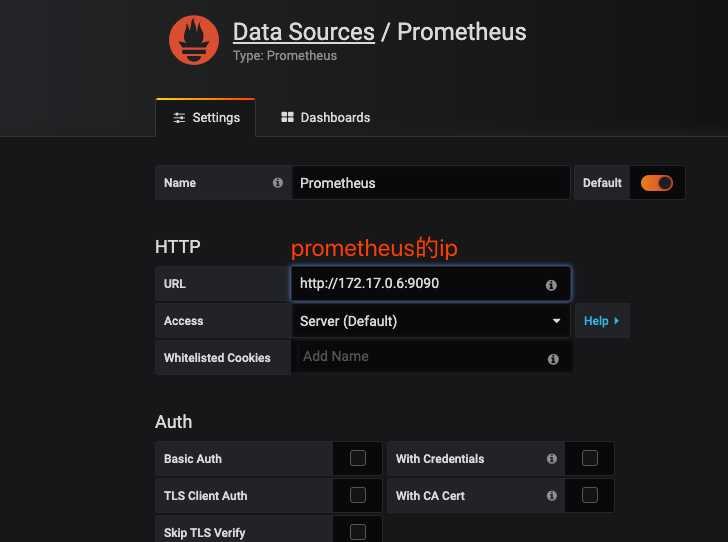
手动部署 Docker+Grafana+Prometheus系统监控之Redis
原文:https://www.cnblogs.com/alin-qu/p/11746128.html