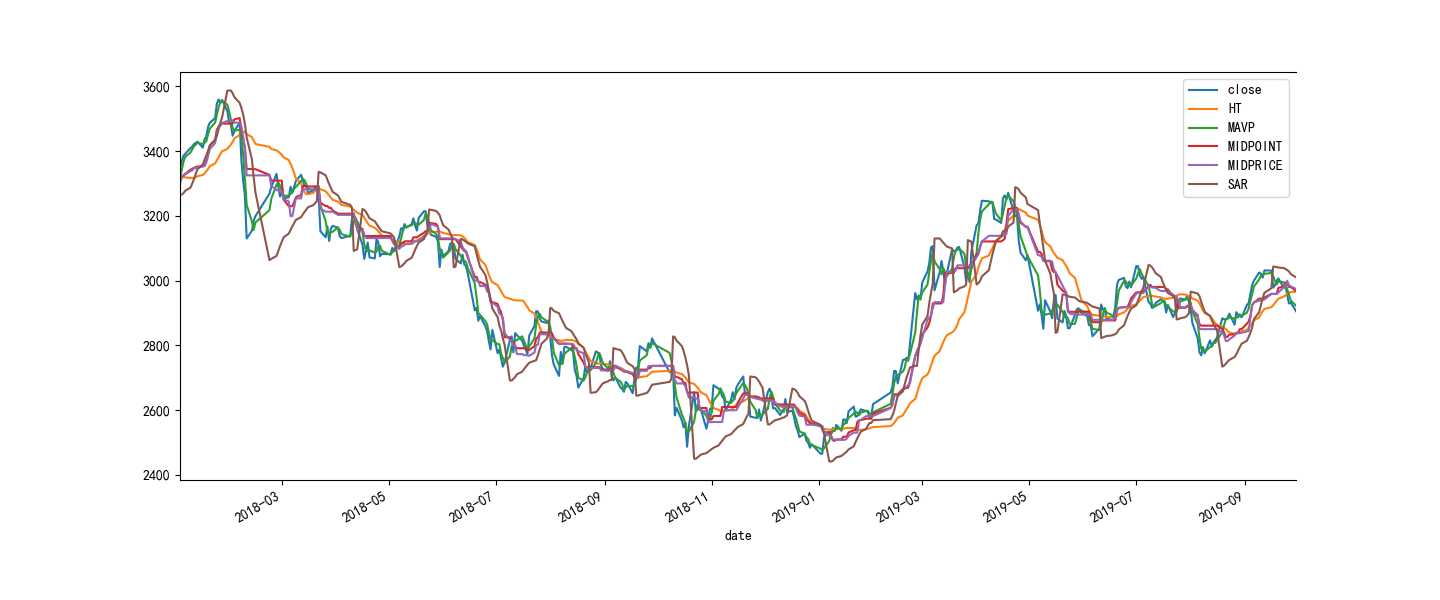
希尔伯特瞬时变换(HT_TRENDLINE):ta.HT_TRENDLINE(close)
Moving average with variable period(MAVP):ta.MAVP(close, periods, maxperiod=30, matype=0)
MidPoint over period(MIDPOINT):ta.MIDPOINT(close, timeperiod=14)
MidPoint Price over period(MIDPRICE):ta.MIDPRICE(high, low, acceleration=0, maximum=0)
抛物线指标(SAR):ta.SAR(high, low, acceleration=0, maximum=0)
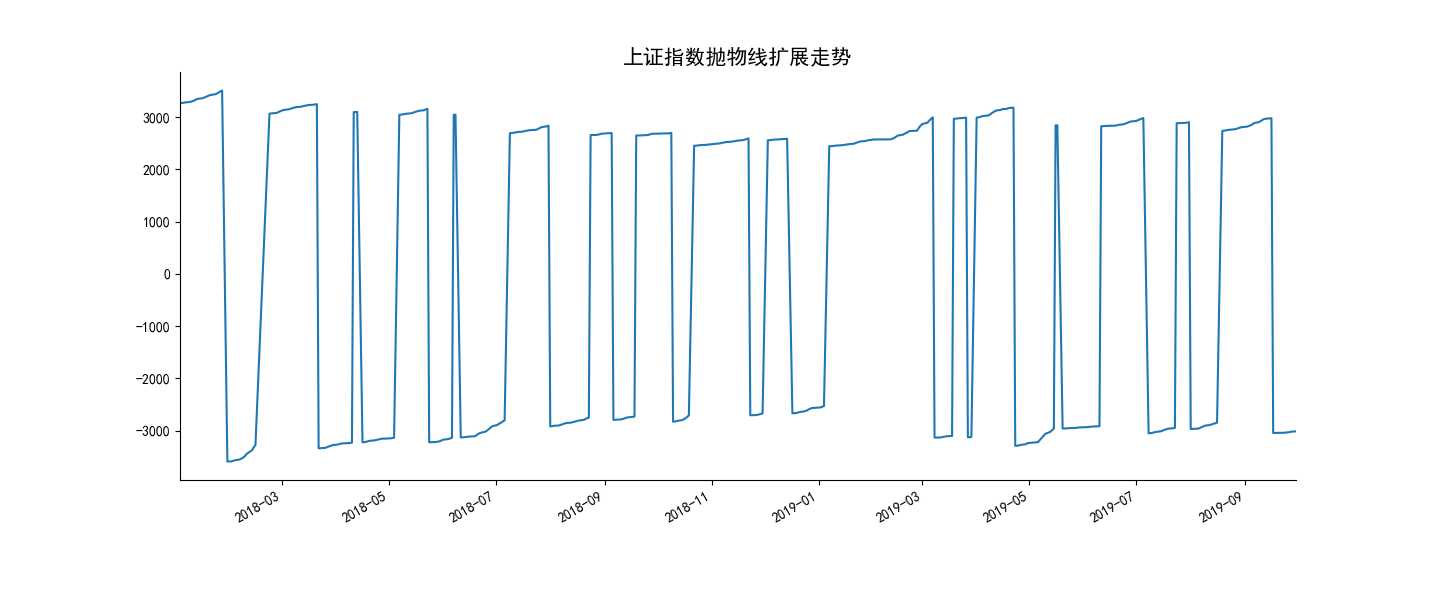
抛物线扩展指标(SAREXT):ta.SAREXT(high, low)

import pandas as pd
import numpy as np
import matplotlib.pyplot as plt
import talib as ta
import tushare as ts

plt.rcParams[‘font.sans-serif‘] = [‘SimHei‘]
plt.rcParams[‘axes.unicode_minus‘] = False

df = ts.get_k_data(‘sh‘, start=‘2000-01-01‘)
df.index = pd.to_datetime(df.date)
df = df.sort_index()

df2 = pd.DataFrame(df.close)
df2[‘HT‘] = ta.HT_TRENDLINE(df.close)
periods = np.array([3]*len(df), dtype=float)
df2[‘MAVP‘] = ta.MAVP(df.close, periods)
df2[‘MIDPOINT‘] = ta.MIDPOINT(df.close)
df2[‘MIDPRICE‘] = ta.MIDPRICE(df.high, df.low)
df2[‘SAR‘] = ta.SAR(df.high, df.low)
df2[‘SAREXT‘] = ta.SAREXT(df.high, df.low)
df2.tail()

df2.loc[‘2018-01-01‘:‘2019-09-30‘,
        [‘close‘, ‘HT‘, ‘MAVP‘, ‘MIDPOINT‘, ‘MIDPRICE‘, ‘SAR‘]
        ].plot(figsize=(16,6))
ax = plt.gca()
ax.spines[‘right‘].set_color(‘none‘)
ax.spines[‘top‘].set_colot(‘none‘)
plt.title(‘上证指数其他趋势指标‘, fontsize=15)
plt.xlabel(‘‘)
plt.show()
df2.loc[‘2018-01-01‘:‘2019-09-30‘, ‘SAREXT‘].plot(figsize=(16,6))
ax = plt.gca()
ax.spines[‘right‘].set_color(‘none‘)
ax.spines[‘top‘].set_color(‘none‘)
plt.title(‘上证指数抛物线扩展走势‘, fontsize=15)
plt.xlabel(‘‘)
plt.show()
原文:https://www.cnblogs.com/wintalau/p/11616316.html
