以下用sns作为seaborn的别名
1.seaborn整体布局设置
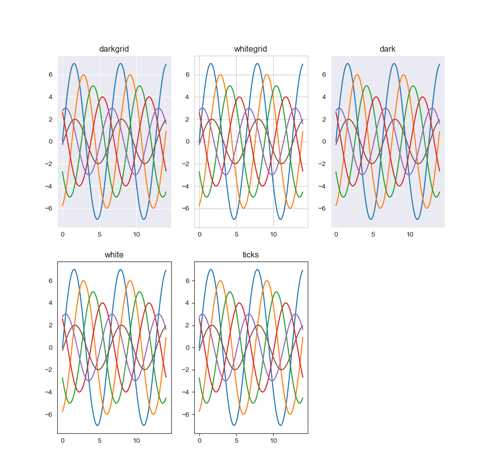
sns.set_syle()函数设置图的风格,传入的参数可以是"darkgrid", "whitegrid", "dark", "white", "ticks", 分别代表五种风格。sns.despine()可以去掉右边和上面的边线。
下面的代码画出五种风格的图
 1 import seaborn as sns
 2 import numpy as np
 3 import matplotlib as mpl
 4 import matplotlib.pyplot as plt
 5
 6
 7 def sinplot(ax):
 8     x = np.linspace(0, 14, 100)
 9     for i in range(6):
10         y = np.sin(x+i*5)*(7-i)
11         ax.plot(x, y)
12
13
14 style = ["darkgrid", "whitegrid", "dark", "white", "ticks"]
15 print(style[0])
16
17 plt.figure(figsize=(10, 10))
18 for i in range(5):
19     sns.set_style(style[i])   #设置样式一定要在子图的定义之前!!!!!!!
20     ax = plt.subplot(2, 3, i+1)
21     ax.set_title(style[i])
22     sinplot(ax)
23
24 plt.show()
运行结果如下
原文:https://www.cnblogs.com/loubin/p/11257354.html