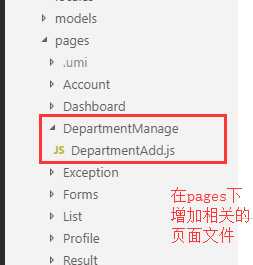
1.增加路由子页面&配置菜单
因为ant design pro采取的是umi路由配置,所以只要在对应的文件夹下新建相关的文件夹以及文件,它会自动解析。按照如下的步骤做即可
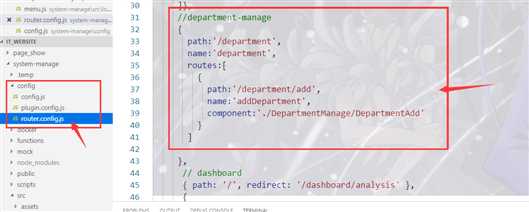
PS.如果想要给菜单配置icon,ant design pro有一些通用的icon图标,可以在上面配置路由的时候在每个路由处都加上 icon:‘iconname‘ 即可,这是最简单的方法。
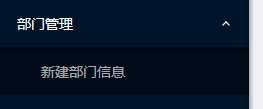
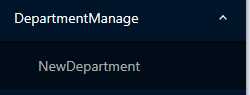
配置了路由以后再给它配置相关的语言预设即可,在这里我只配置了中文和英文。
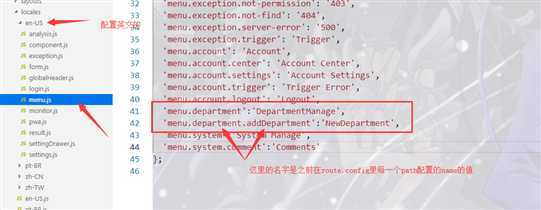
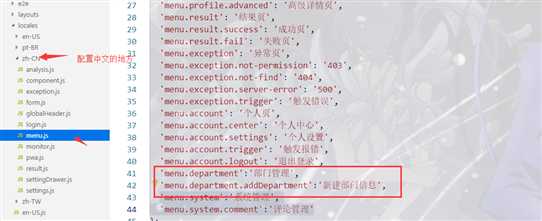
这样页面上的菜单就会有相应的配置了。
2.使用mock模拟后台数据调用

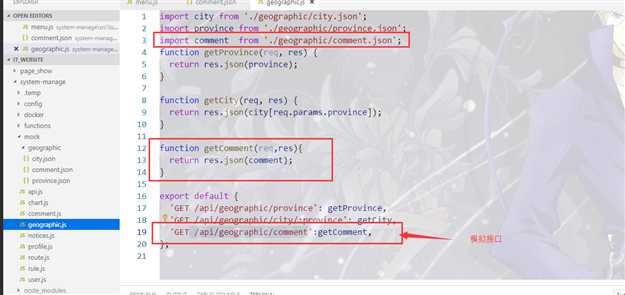
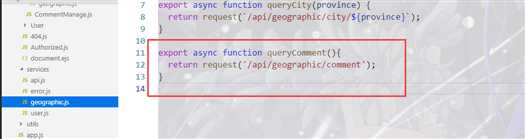
在service里写相应的请求接口的逻辑,这里的request是ant design pro里自定义的接口请求方法,封装了fetch方法。
然后在相应的组件内建立models,触发action获得数据(这里用的是redux的思想)
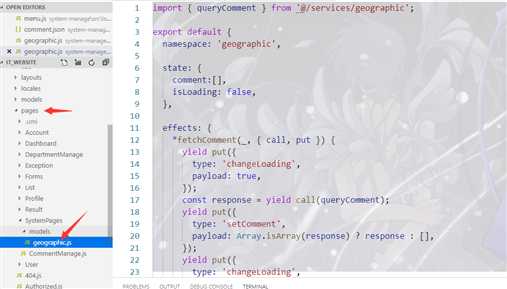
完整的代码如下:
import { queryComment } from ‘@/services/geographic‘;

export default {
  namespace: ‘geographic‘, //命名空间,这里与组件里连接到模块的connect方法里的参数对应

  state: {
    comment:[],
    isLoading: false,
  },
//actions
  effects: {
    *fetchComment(_, { call, put }) {
      //yield 关键字用来暂停和恢复一个生成器函数((function* 或遗留的生成器函数)。
      yield put({
        type: ‘changeLoading‘,
        payload: true,
      });
      const response = yield call(queryComment); //这里是请求到的数据
      yield put({
        type: ‘setComment‘,
        payload: Array.isArray(response) ? response : [],
      });
      yield put({
        type: ‘changeLoading‘,
        payload: false,
      });
    },
  },
  //reducers指定了应用状态的变化如何响应actions并发送到store
  reducers: {
    setComment(state, action) {
      return {
        ...state,
        comment: action.payload,
      };
    },
    changeLoading(state, action) {
      return {
        ...state,
        isLoading: action.payload,
      };
    },
  },
};
在相应的组件中取相应的数据展示页面
import React, { Component } from ‘react‘;
import {connect} from ‘dva‘;
import {Table} from ‘antd‘;


//取对应的模块
@connect(({geographic , loading }) => (
  {
   geographic ,
   isLoading:loading.effects[‘geographic/fetchComment‘],
 }
))

export default class CommentManage extends Component{

    componentDidMount(){
        const {dispatch}=this.props;
        //触发dispatch方法来触发action从而更改状态
        dispatch({
            type:‘geographic/fetchComment‘
        })
    }
    handleChange=(current,pageSize)=>{

    render(){


        const columns = [

          {
            title: ‘姓名‘,
            dataIndex: ‘name‘,
            key: ‘name‘,
          },
          {
            title: ‘所评文章ID‘,
            dataIndex: ‘article_id‘,
            key: ‘article_id‘,

          },

          {
            title: ‘评论内容‘,
            dataIndex: ‘content‘,
            key: ‘content‘,
          },{
            title:‘时间‘,
            dataIndex:‘create_by‘,
            key:‘create_by‘
          }];
        const { isLoading } = this.props;
        const {geographic:{comment}}=this.props;
        const dataSource=[...comment];

        // console.log(dataSource)
        return (
            <div>
                <Table
                   bordered
                   dataSource={dataSource}
                   columns={columns}
                   size="small" />

            </div>
        )
    }
}
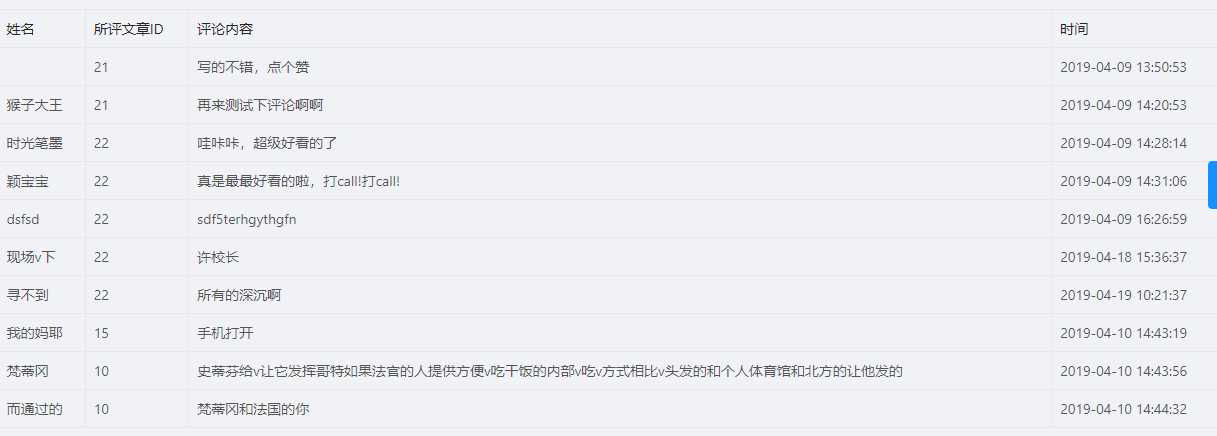
然后页面上就能展示相应的数据了
原文:https://www.cnblogs.com/LULULI/p/10873756.html