initChart: function (id) {
this.charts = echarts.init(document.getElementById(id))
this.charts.setOption({
xAxis: {
type: ‘category‘,
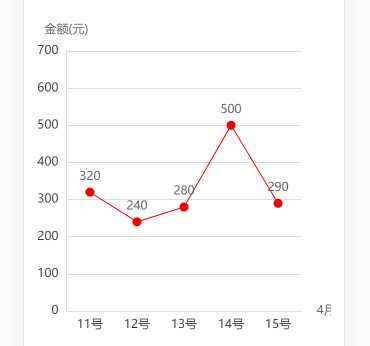
data: [‘11号‘, ‘12号‘, ‘13号‘, ‘14号‘, ‘15号‘],
color: [‘#DDDDDD‘],
name:‘4月‘,
show: true,
nameTextStyle: {
color: ‘#636363‘, // 坐标轴名称样式
left:‘0‘
},
axisLine: {
lineStyle: {
color: ‘#DDDDDD‘,
width: 1
}
},
axisTick: { //去除刻度线
show: false
},
axisLabel: {
show: true, //坐标轴的文字是否显示
textStyle: {
color: ‘#323232‘, //坐标轴上的字体颜色
fontSize:‘12‘ // 坐标轴字体大小
}
},
},
yAxis: {
type: ‘value‘,
name:‘金额(元)‘,
show: true,
nameTextStyle: {
color: ‘#636363‘, // 坐标轴名称样式
left:‘0‘
},
axisLine: {
lineStyle: {
color: ‘#DDDDDD‘,
width: 1
},
textStyle: {
color: ‘#323232‘, //x轴上的字体颜色
fontSize:‘11‘ // x轴字体大小
}
},
axisTick: { //去除刻度线
show: false
},
axisLabel: {
show: true, //坐标轴的文字是否显示
textStyle: {
color: ‘#323232‘, //坐标轴上的字体颜色
fontSize:‘12‘ // 坐标轴字体大小
}
},
splitLine:{
show:true ,
lineStyle:{
color:‘#DCDCDC‘,
width: 1
}
},
min:0, //坐标轴最大值
max:700, //坐标轴最大值
splitNumber:10, //间隔线间距
},
series: [{
data: [320, 240, 280, 500, 290],
type: ‘line‘,
color: ‘#F40000‘,
symbol: ‘circle‘,//折线点设置为实心点
symbolSize: 9, //折线点的大小
symbol:‘circle‘,
smooth:false,
itemStyle:{
normal:{
// color:‘#ddd‘,
lineStyle:{
width:1,
type:‘solid‘, //‘dotted‘虚线 ‘solid‘实线
color:‘#F40000‘,
},
label : { //折线上的数据
show: true,
position: ‘top‘,
color:‘#636363‘
},
}
}
}]
});
原文:https://www.cnblogs.com/Kyaya/p/10850849.html