在使用memory_profiler模块0.55.0版本执行命令诊断程序内存用量时,遇到下面错误:
C:\Users\Chen\Desktop\python_doc\第四模块课件>python -m memory_profiler tr1y.py
Traceback (most recent call last):
  File "C:\Users\Chen\Python36\lib\runpy.py", line 193, in _run_module_as_main
    "__main__", mod_spec)
  File "C:\Users\Chen\Python36\lib\runpy.py", line 85, in _run_code
    exec(code, run_globals)
  File "C:\Users\Chen\Python36\lib\site-packages\memory_profiler.py", line 1227, in <module>
    exec_with_profiler(script_filename, prof, args.backend, script_args)
  File "C:\Users\Chen\Python36\lib\site-packages\memory_profiler.py", line 1128, in exec_with_profiler
    exec(compile(f.read(), filename, ‘exec‘), ns, ns)
UnicodeDecodeError: ‘gbk‘ codec can‘t decode byte 0x8b in position 331: illegal multibyte sequence
根据提示我找到memory_profiler模块,查看源码line1128附近,原来在line1127出了问题:
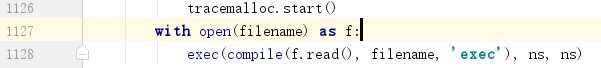
因为我用的是国产windows系统,默认字符编码是gbk,若无指定打开文件时也会用gbk,但是我要检测的脚本文件使用utf-8字符编码,因此,改成
with open(filename, encoding=‘utf-8‘)就好了,顺利输出诊断信息:
C:\Users\Chen\Desktop\python_doc\第四模块课件>python -m memory_profiler tr1y.py
(1.800000000000033, -1.800000000000033)
length of x: 1000
total elements: 1000000
Filename: tr1y.py

Line #    Mem usage    Increment   Line Contents
================================================
    49  111.680 MiB  111.680 MiB   @profile
    50                             def calculate_z_serial_purepython(max_iter, zs, cs):
    51  119.312 MiB    7.633 MiB       output = [0] * len(zs)
    52  119.336 MiB    0.000 MiB       for i in range(len(zs)):
    53  119.336 MiB    0.008 MiB           n = 0
    54  119.336 MiB    0.012 MiB           z = zs[i]
    55  119.336 MiB    0.000 MiB           c = cs[i]
    56  119.336 MiB    0.004 MiB           while abs(z) < 2 and n < max_iter:
    57  119.320 MiB    0.000 MiB               z = z * z + c
    58  119.320 MiB    0.000 MiB               n += 1
    59  119.336 MiB    0.000 MiB           output[i] = n
    60  119.258 MiB    0.000 MiB       return output
顺便说一下:从诊断信息来看,在执行line51生成output列表时,可见7MB的RAM被加入这个进程,但这不意味着output列表大小就是7MB,只是进程在列表内部分配时增长了大约7MB。
原文:https://www.cnblogs.com/tarantino/p/10802567.html