1、柱状图:
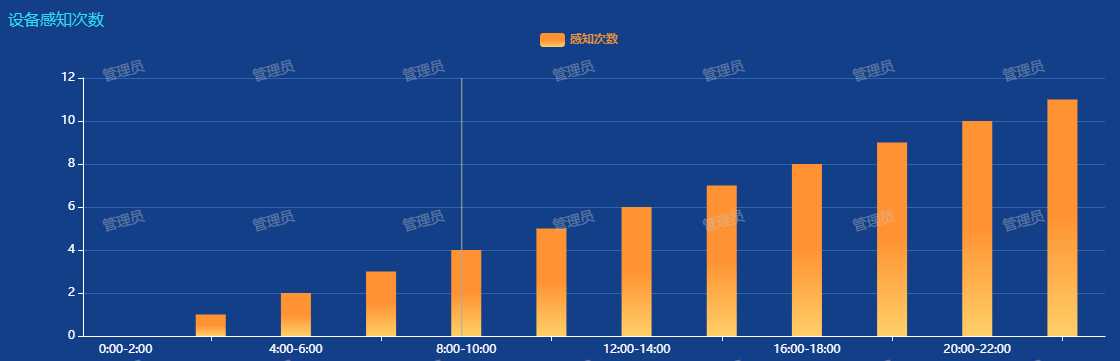
1、需要动态加载的参数是x轴以及柱状图的数值,legendData和seriesData。demo使用是可以直接写死参数,在执行this.initChart()方法即可。具体代码可以参数以下code.

<!--门禁卡开门统计-->
<template>
  <div class="openCardCountEle" style="height: 90%;width: 100%;padding: 4px;" v-loading="isLoading">
    <div style="width: 100%;height: 100%;z-index: 0">
      <div id="openCardCountEleID"></div>
    </div>
  </div>
</template>

<script>
  import echarts from ‘echarts‘;
  import {getFileDetail30DaysTime} from ‘api/viasadmin/arcgisMap/IntelDigCtrl‘;
  import {openCardCount} from ‘api/dashboard‘;
  export default {
    name: "openCardCountEle",
    props:[‘curDAItem‘],
    data() {
      return {
        chart: null,
        id: ‘openCardCountEleID‘,
        isLoading: false,
        color: [
          ‘#ff8463‘,‘#9bca62‘,‘#2ec7c9‘,‘#b6a2de‘,‘#5ab1ef‘,
          ‘#8d98b3‘,‘#e5cf0d‘,‘#97b552‘,‘#95706d‘,‘#dc69aa‘,
          ‘#07a2a4‘,‘#9a7fd1‘,‘#588dd5‘,‘#f5994e‘,‘#c05050‘,
          ‘#59678c‘,‘#c9ab00‘,‘#7eb00a‘,‘#6f5553‘,‘#c14089‘
        ],
        legendData: [‘0:00-2:00‘, ‘2:00-4:00‘, ‘4:00-6:00‘, ‘6:00-8:00‘, ‘8:00-10:00‘, ‘10:00-12:00‘,
          ‘12:00-14:00‘,‘14:00-16:00‘,‘16:00-18:00‘,‘18:00-20:00‘,‘20:00-22:00‘,‘22:00-24:00‘],
        seriesData:[],
        // seriesData:[10, 52, 200, 334, 390, 330, 220],
      };
    },
    beforeDestroy() {
      if (!this.chart) {return false;}
      this.chart.dispose();
      this.chart = null;
    },
    beforeCreate(){},
    created(){},
    mounted() {
      this.$nextTick(() => {
        this.getList();
        // this.initChart();
      });
    },
    methods: {
      getList(){
         //获取上次的勾选记录
        this.isLoading = true;
        const param ={
          archivesCode:this.curDAItem.archivesCode,
          topNum:10
        }
        getFileDetail30DaysTime(param).then(rsp=>{
          this.isLoading = false;
          if(rsp.status == 200 && rsp.data){
           this.seriesData = rsp.data;
          } else {
            this.seriesData =[];
          }
          this.initChart();
        })
      },
      initChart() {
        $("#openCardCountEleID").width($(".openCardCountEle").width());
        $("#openCardCountEleID").height($(".openCardCountEle").height());
        this.chart = echarts.init(document.getElementById(this.id));
        this.chart.setOption({
          color: this.color,
          grid: {
            left: ‘80px‘,
            right: ‘50px‘,
            top: ‘70px‘,
            bottom:‘30px‘,

          },
          legend: {
            data: [‘感知次数‘],
            top: 20,
            textStyle:{color:‘#E69142‘, fontWeight:‘bold‘},
          },
          title: {
            text: ‘设备感知次数‘,
            textStyle:{
              fontSize: 16,
              fontWeight: "normal",
              color: "#32DBEF"
            }
          },
          tooltip: {
            trigger: ‘axis‘,
            showDelay:200,
          },
          xAxis: {
            type: ‘category‘,
            data: this.legendData,
            axisLine: {
              lineStyle: {
                color: ‘#fff‘,
                width: 1,//这里是为了突出显示加上的
              },
            },
            splitLine: {
              show: false,
              lineStyle:{color: [‘#2E65B1‘], width: 1, type: ‘solid‘}
            }
          },
          yAxis : [{
              axisLine: {lineStyle: {color: ‘#fff‘, width: 1}},
              type : ‘value‘,
              splitLine: {show: true, lineStyle:{color: [‘#2E65B1‘], width: 1, type: ‘solid‘}},
              axisLabel: {show: true, textStyle: {color: ‘#fff‘}}
            }],
          series : [
            {
              name:‘感知次数‘,
              type:‘bar‘,
              data:this.seriesData,
              barMaxWidth: ‘30‘,
              itemStyle: {
                normal: {
                  color: new echarts.graphic.LinearGradient(0, 1, 0, 0, [{
                    offset: 0,
                    color: "#FFCF68" // 0% 处的颜色
                  },{
                    offset: 0.5,
                    color: "#ff9333" // 100% 处的颜色
                  }, {
                    offset: 1,
                    color: "#ff9333" // 100% 处的颜色
                  }], false)
                }
              }
            }
          ]
        },true);

      }
    }
  }
</script>

<style scoped></style>
原文:https://www.cnblogs.com/luoxuemei/p/10716046.html
