引用地址:https://www.kaggle.com/selfishgene/psychology-of-a-professional-athlete
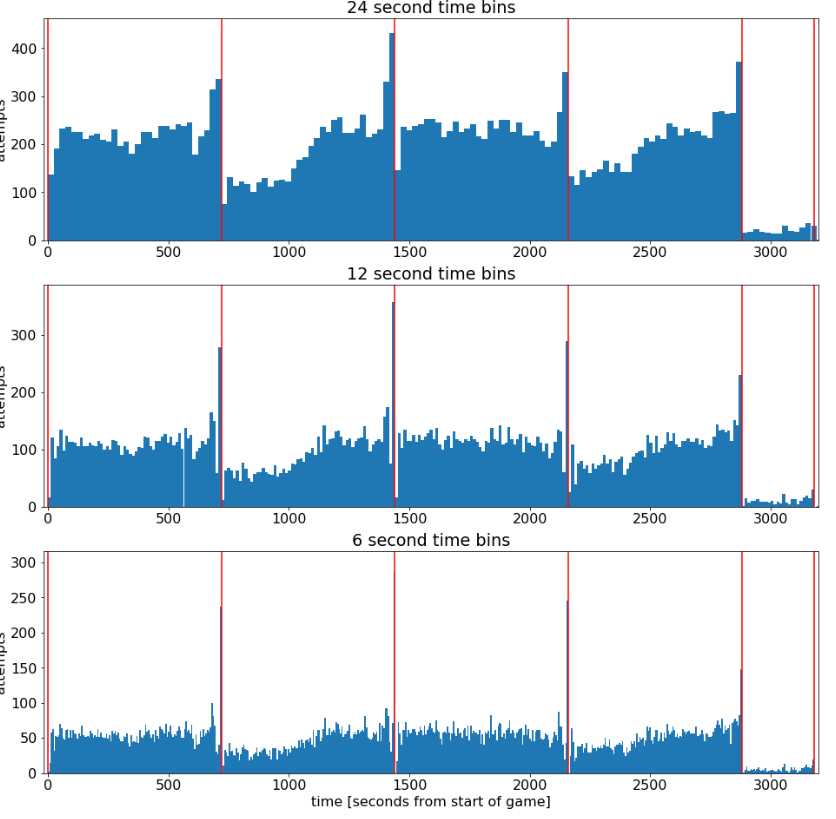
# plot the shot attempts as a function of time (from start of game) with several different binnings
plt.rcParams[‘figure.figsize‘] = (16, 16)
plt.rcParams[‘font.size‘] = 16

binsSizes = [24,12,6]

plt.figure();
for k, binSizeInSeconds in enumerate(binsSizes):
    timeBins = np.arange(0,60*(4*12+3*5),binSizeInSeconds)+0.01
    attemptsAsFunctionOfTime, b = np.histogram(data[‘secondsFromGameStart‘], bins=timeBins)

    maxHeight = max(attemptsAsFunctionOfTime) + 30
    barWidth = 0.999*(timeBins[1]-timeBins[0])
    plt.subplot(len(binsSizes),1,k+1);
    plt.bar(timeBins[:-1],attemptsAsFunctionOfTime, align=‘edge‘, width=barWidth); plt.title(str(binSizeInSeconds) + ‘ second time bins‘)
    plt.vlines(x=[0,12*60,2*12*60,3*12*60,4*12*60,4*12*60+5*60,4*12*60+2*5*60,4*12*60+3*5*60], ymin=0,ymax=maxHeight, colors=‘r‘)
    plt.xlim((-20,3200)); plt.ylim((0,maxHeight)); plt.ylabel(‘attempts‘)
plt.xlabel(‘time [seconds from start of game]‘)
原文:https://www.cnblogs.com/figo-studypath/p/9282214.html