import csv
from matplotlib import pyplot as plt
from datetime import datetime
fileName = ‘sitka_weather_07-2014.csv‘
with open(fileName) as f:
reader = csv.reader(f)
header_row = next(reader)
# print(header_row)
# for index, column_header in enumerate(header_row): # 在同时需要index和value值的时候可以使用 enumerate
# # print(index, column_header)
dates,hights = [], []
for row in reader:
current_date = datetime.strptime(row[0], ‘%Y-%m-%d‘)
dates.append(current_date)
hights.append(int(row[1]))
print(hights)
fig = plt.figure(dpi=128, figsize=(10, 6))
plt.plot(dates, hights, c=‘red‘)
# 设置图形的格式
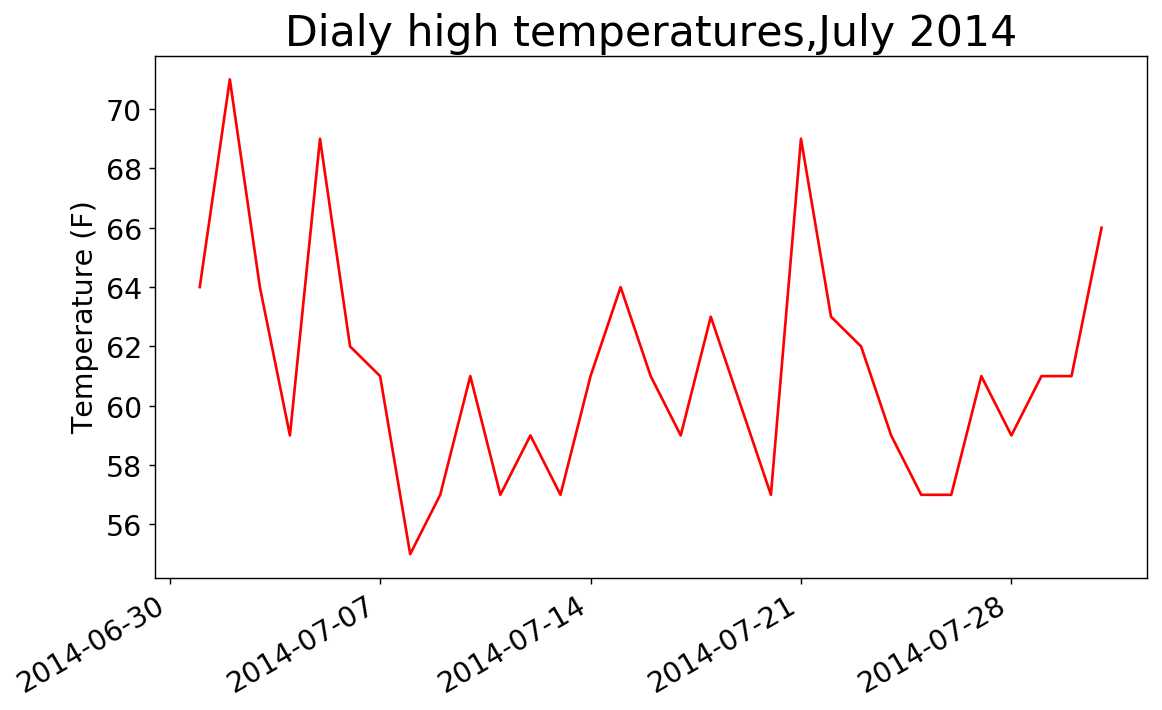
plt.title("Dialy high temperatures,July 2014", fontsize=24)
plt.xlabel(‘‘, fontsize=16)
fig.autofmt_xdate()
plt.ylabel("Temperature (F)", fontsize=16)
plt.tick_params(axis=‘both‘, which=‘major‘, labelsize=16)
plt.savefig("temperature.png", bbox_inches=‘tight‘)
plt.show()
运行结果
python读csv格式文档并用matplotlib绘制图表
原文:https://www.cnblogs.com/endian11/p/9076785.html