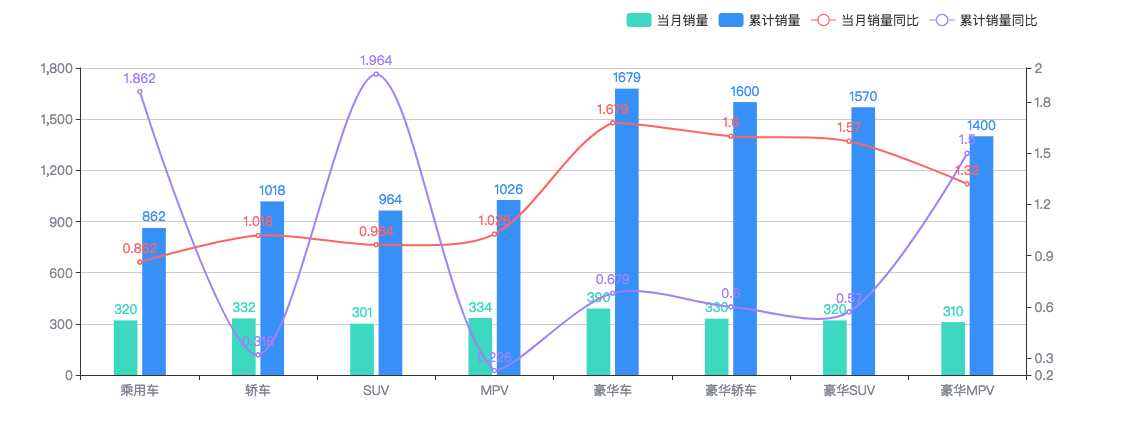
总体的市场情况
这里我需要4个data数组。
var list = [
[],//这里表示当月数据量,数组长度8
[],//这里表示的累计数据量,数组长度8
[],//这里表示的当月数据量同比,数组长度8
[]//这里表示的累计数据量同比,数组长度8
]
<!doctype html>
<html lang="en">
<head>
  <meta charset="UTF-8" />
  <title>Document</title>
  <script src="https://cdn.bootcss.com/echarts/3.7.1/echarts.js"></script>
</head>
<body>
  <div id="app" style="height:400px">

  </div>
  <script>
    window.myChart = echarts.init(document.querySelector(‘#app‘));
    var option = {
      tooltip : {
        trigger: ‘axis‘,
        axisPointer : {            // 坐标轴指示器,坐标轴触发有效
            type : ‘shadow‘        // 默认为直线,可选为:‘line‘ | ‘shadow‘
        }
    },
    legend: {
        data:[‘当月销量‘,‘累计销量‘,‘当月销量同比‘,‘累计销量同比‘],
        right:‘5%‘
    },
    grid: {
        left: ‘3%‘,
        right: ‘4%‘,
        bottom: ‘3%‘,
        containLabel: true
    },
    xAxis : [
        {
            type : ‘category‘,
            data : [‘乘用车‘,‘轿车‘,‘SUV‘,‘MPV‘,‘豪华车‘,‘豪华轿车‘,‘豪华SUV‘,‘豪华MPV‘],
            axisLabel:{
                //formatter: ‘{value}%‘,
                /*formatter:function(e){
                    return window.tools.toThousands(parseInt(e))+"%"
                },*/
                textStyle:{
                    color: ‘#80848f‘
                }
            },
        }
    ],
    yAxis : [
        {
            type : ‘value‘,
            position: ‘left‘,
            axisLabel:{
                //formatter: ‘{value}%‘,
                /*formatter:function(e){
                    return window.tools.toThousands(parseInt(e))+"%"
                },*/
                textStyle:{
                    color: ‘#80848f‘
                }
            },
        },
        {
            axisLabel:{
                //formatter: ‘{value}%‘,
                /*formatter:function(e){
                    return window.tools.toThousands(parseInt(e))+"%"
                },*/
                textStyle:{
                    color: ‘#80848f‘
                }
            },
            splitLine : {
                show: false
            },
            type: ‘value‘,
            position: ‘right‘,
            min:0.2,
            max:2
        }
    ],

    series : [
        {
            name:‘当月销量‘,
            type:‘bar‘,
            data:[320, 332, 301, 334, 390, 330, 320,310],
            barWidth: ‘20%‘,
            itemStyle:{
                normal:{
                    color:‘#3cd8c0‘
                }
            },
            label: {
                normal: {
                    show: true,
                    position: ‘top‘,
                    textStyle:{
                        color:‘#3cd8c0‘
                    },
                    /*formatter:function(e){
                        e.data = window.tools.toThousands(parseInt(e.data));
                        e.data = e.data+"%";
                        return e.data;
                    }*/
                }
            }
        },
        {
            name:‘累计销量‘,
            type:‘bar‘,
            data:[862, 1018, 964, 1026, 1679, 1600, 1570, 1400],

            barGap: ‘20%‘,//两个柱之间的距离 或者距离前面的距离
            barWidth: ‘20%‘,
            itemStyle:{
                normal:{
                    color:‘#3790f8‘
                }
            },
            label: {
                normal: {
                    show: true,
                    position: ‘top‘,
                    textStyle:{
                        color:‘#3790f8‘
                    },
                    /*formatter:function(e){
                        e.data = window.tools.toThousands(parseInt(e.data));
                        e.data = e.data+"%";
                        return e.data;
                    }*/
                }
            }
        },
        {
            name:‘当月销量同比‘,
            type:‘line‘,
            animationDuration: 2200,
            yAxisIndex:1,
            itemStyle:{
                normal:{
                    color:‘#fc6363‘,
                }
            },
            label: {
                normal: {
                    show: true,
                    position: ‘top‘,
                    textStyle:{
                        color:‘#fc6363‘
                    },
                    /*formatter:function(e){
                        e.data = window.tools.toThousands(parseInt(e.data));
                        e.data = e.data+"%";
                        return e.data;
                    }*/
                }
            },
            smooth: true,
            data: [0.862, 1.018, 0.964, 1.026, 1.679, 1.600, 1.570, 1.32]
        },
        {
            name:‘累计销量同比‘,
            type:‘line‘,
            animationDuration: 2200,
            yAxisIndex:1,
            itemStyle:{
                normal:{
                    color:‘#a37ffa‘,
                }
            },
            label: {
                normal: {
                    show: true,
                    position: ‘top‘,
                    textStyle:{
                        color:‘#a37ffa‘
                    },
                    /*formatter:function(e){
                        e.data = window.tools.toThousands(parseInt(e.data));
                        e.data = e.data+"%";
                        return e.data;
                    }*/
                }
            },
            smooth: true,
            data: [1.862, 0.318, 1.964, 0.226, 0.679, 0.600, 0.570, 1.5]
        }
    ]
    }
    window.myChart.setOption(option, true);
  </script>
</body>
</html>
原文:http://www.cnblogs.com/coding4/p/7519714.html