library(lattice)
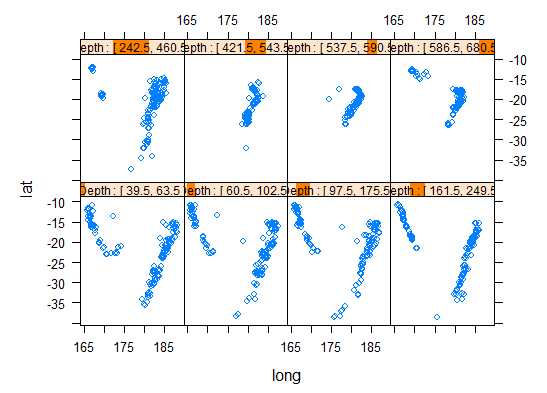
Depth <- equal.count(quakes$depth, number=8, overlap=.1)xyplot(lat ~ long | Depth, data = quakes)
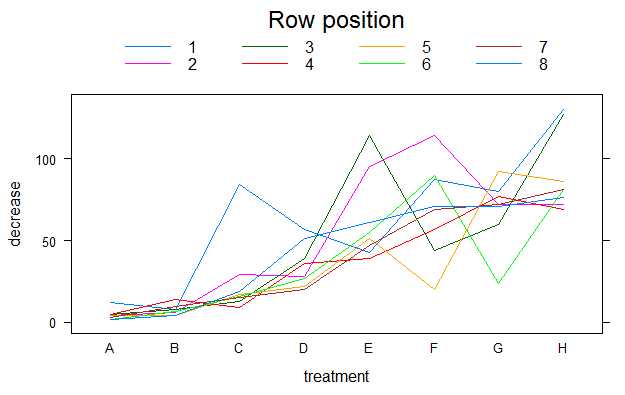
lattice 作图 举例
原文:http://www.cnblogs.com/arcserver/p/6437713.html