There are a number of R packages implementing principal component methods. These packages include: FactoMineR, ade4,stats, ca, MASS and ExPosition.
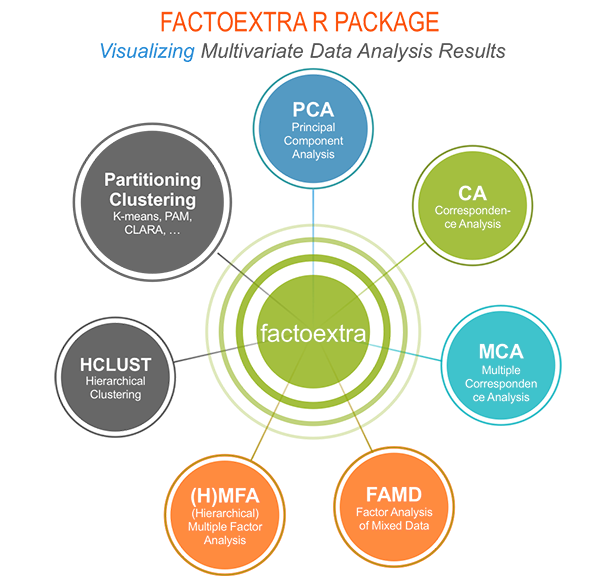
However, the result is presented differently according to the used packages. To help in the interpretation and in the visualization of multivariate analysis - such as cluster analysis and dimensionality reduction analysis - we developed an easy-to-use R package named factoextra.
We’ll use i) the FactoMineR package (Sebastien Le, et al., 2008) to compute PCA, (M)CA, FAMD, MFA and HCPC; ii) and the factoextra package for extracting and visualizing the results.
FactoMineR is a great and my favorite package for computing principal component methods in R. It’s very easy to use and very well documented. The official website is available at: http://factominer.free.fr/. Thanks to Fran?ois Husson for his impressive work.
Main functions in the factoextra package
See the online documentation (http://www.sthda.com/english/rpkgs/factoextra) for a complete list.
Visualizing dimension reduction analysis outputs
| fviz_eig (or fviz_eigenvalue) |
Extract and visualize the eigenvalues/variances of dimensions. |
| fviz_pca |
Graph of individuals/variables from the output of Principal Component Analysis (PCA). |
| fviz_ca |
Graph of column/row variables from the output of Correspondence Analysis (CA). |
| fviz_mca |
Graph of individuals/variables from the output of Multiple Correspondence Analysis (MCA). |
| fviz_mfa |
Graph of individuals/variables from the output of Multiple Factor Analysis (MFA). |
| fviz_famd |
Graph of individuals/variables from the output of Factor Analysis of Mixed Data (FAMD). |
| fviz_hmfa |
Graph of individuals/variables from the output of Hierarchical Multiple Factor Analysis (HMFA). |
| fviz_ellipses |
Draw confidence ellipses around the categories. |
| fviz_cos2 |
Visualize the quality of representation of the row/column variable from the results of PCA, CA, MCA functions. |
| fviz_contrib |
Visualize the contributions of row/column elements from the results of PCA, CA, MCA functions. |
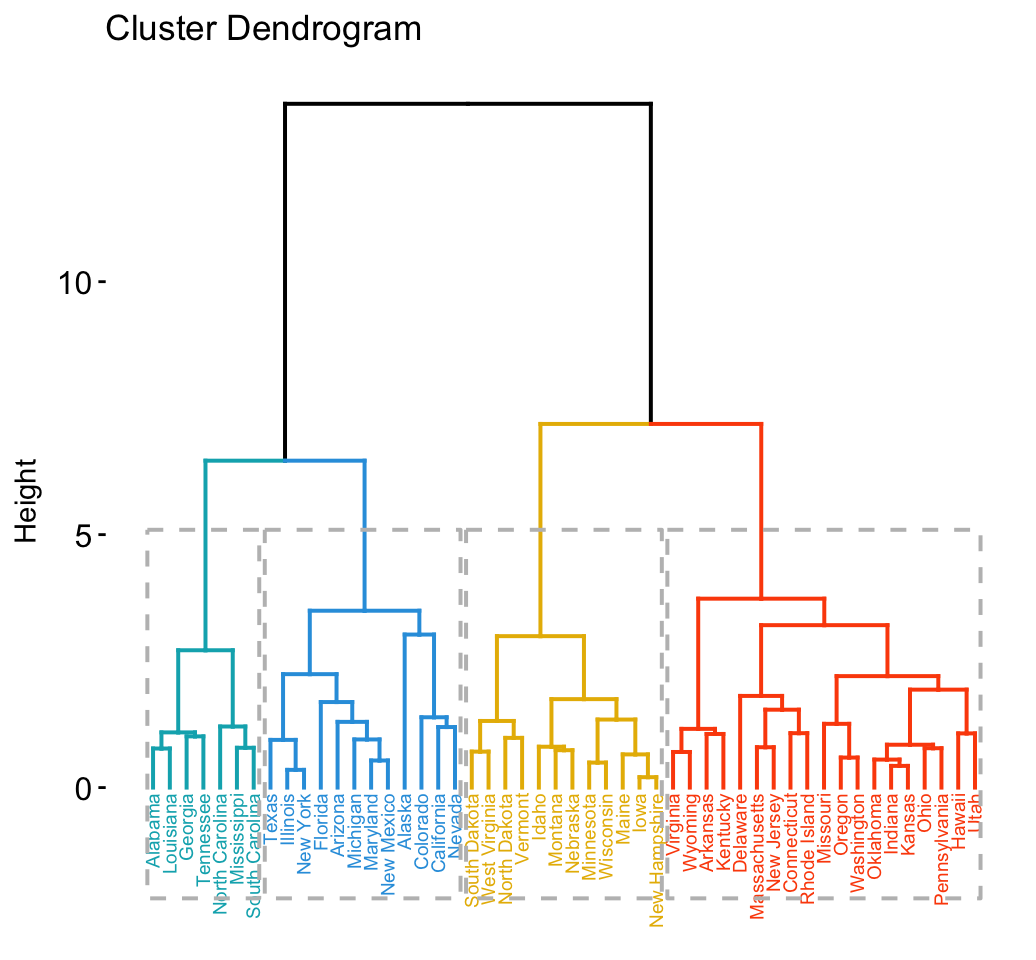
Clustering analysis and visualization
| dist(fviz_dist, get_dist) |
Enhanced Distance Matrix Computation and Visualization. |
| get_clust_tendency |
Assessing Clustering Tendency. |
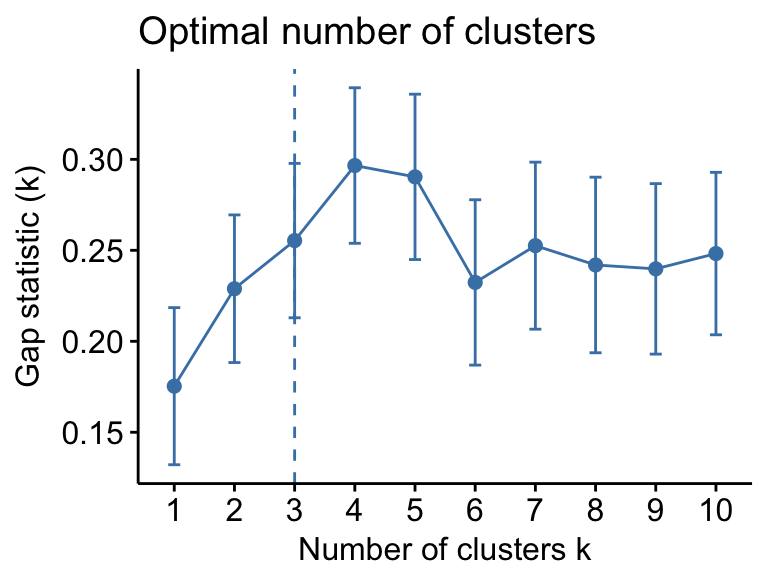
| fviz_nbclust(fviz_gap_stat) |
Determining and Visualizing the Optimal Number of Clusters. |
| fviz_dend |
Enhanced Visualization of Dendrogram |
| fviz_cluster |
Visualize Clustering Results |
| fviz_mclust |
Visualize Model-based Clustering Results |
| fviz_silhouette |
Visualize Silhouette Information from Clustering. |
| hcut |
Computes Hierarchical Clustering and Cut the Tree |
| hkmeans (hkmeans_tree, print.hkmeans) |
Hierarchical k-means clustering. |
| eclust |
Visual enhancement of clustering analysis |
Dimension reduction and factoextra
As depicted in the figure below, the type of analysis to be performed depends on the data set formats and structures.
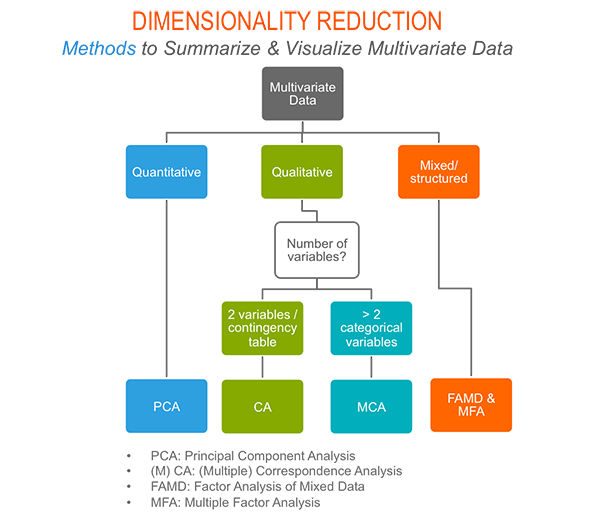
In this section we start by illustrating classical methods - such as PCA, CA and MCA - for analyzing a data set containing continuous variables, contingency table and qualitative variables, respectively.
We continue by discussing advanced methods - such as FAMD, MFA and HMFA - for analyzing a data set containing a mix of variables (qualitatives & quantitatives) organized or not into groups.
Finally, we show how to perform hierarchical clustering on principal components (HCPC), which useful for performing clustering with a data set containing only qualitative variables or with a mixed data of qualitative and quantitative variables.
Principal component analysis
- Data: decathlon2 [in factoextra package]
- PCA function: FactoMineR::PCA()
- Visualization factoextra::fviz_pca()
Read more about computing and interpreting principal component analysis at: Principal Component Analysis (PCA).
- Loading data
library("factoextra")
data("decathlon2")
df <- decathlon2[1:23, 1:10]
- Principal component analysis
library("FactoMineR")
res.pca <- PCA(df,  graph = FALSE)
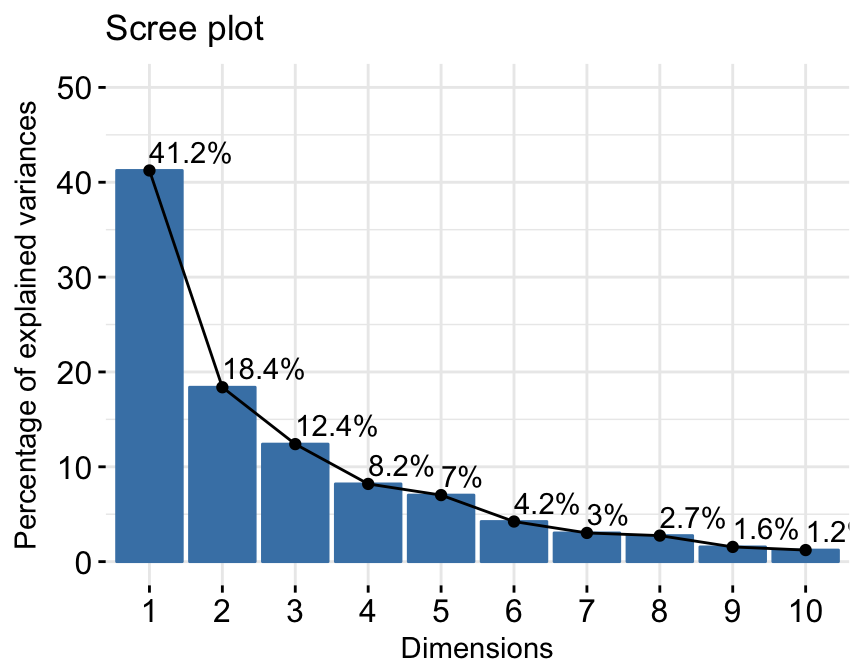
- Extract and visualize eigenvalues/variances:
##        eigenvalue variance.percent cumulative.variance.percent
## Dim.1   4.1242133        41.242133                    41.24213
## Dim.2   1.8385309        18.385309                    59.62744
## Dim.3   1.2391403        12.391403                    72.01885
## Dim.4   0.8194402         8.194402                    80.21325
## Dim.5   0.7015528         7.015528                    87.22878
## Dim.6   0.4228828         4.228828                    91.45760
## Dim.7   0.3025817         3.025817                    94.48342
## Dim.8   0.2744700         2.744700                    97.22812
## Dim.9   0.1552169         1.552169                    98.78029
## Dim.10  0.1219710         1.219710                   100.00000
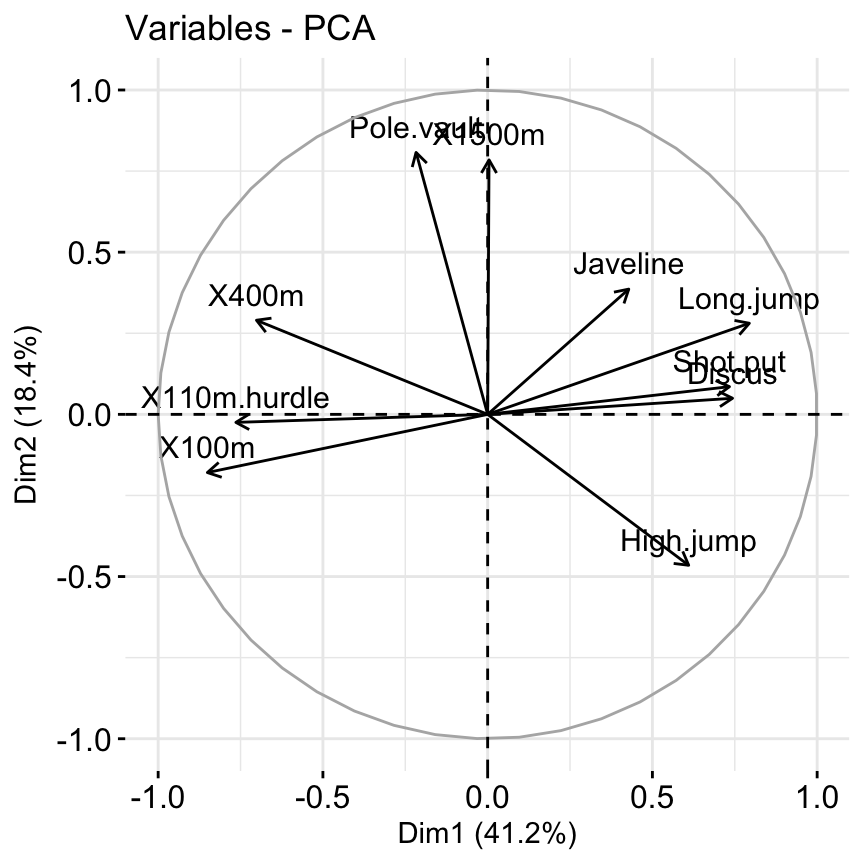
4.Extract and visualize results for variables:
## Principal Component Analysis Results for variables
##  ===================================================
##   Name       Description
## 1 "$coord"   "Coordinates for the variables"
## 2 "$cor"     "Correlations between variables and dimensions"
## 3 "$cos2"    "Cos2 for the variables"
## 4 "$contrib" "contributions of the variables"
##                   Dim.1       Dim.2      Dim.3       Dim.4      Dim.5
## X100m        -0.8506257 -0.17939806  0.3015564  0.03357320 -0.1944440
## Long.jump     0.7941806  0.28085695 -0.1905465 -0.11538956  0.2331567
## Shot.put      0.7339127  0.08540412  0.5175978  0.12846837 -0.2488129
## High.jump     0.6100840 -0.46521415  0.3300852  0.14455012  0.4027002
## X400m        -0.7016034  0.29017826  0.2835329  0.43082552  0.1039085
## X110m.hurdle -0.7641252 -0.02474081  0.4488873 -0.01689589  0.2242200
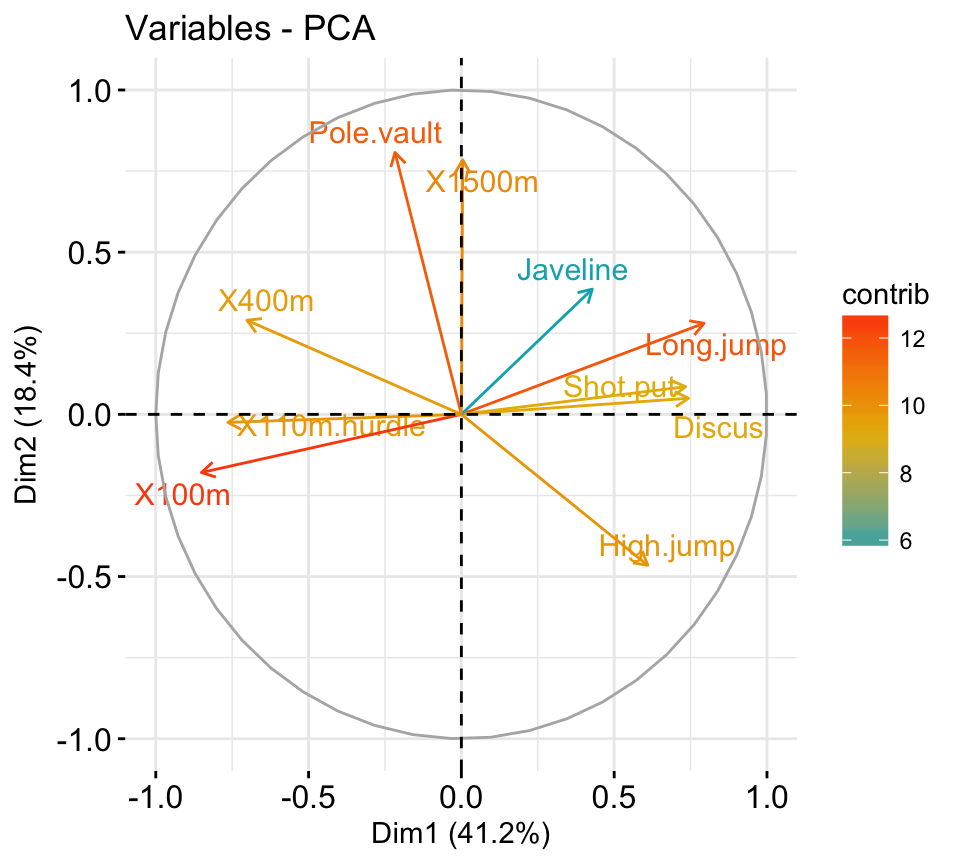
##                  Dim.1      Dim.2     Dim.3       Dim.4     Dim.5
## X100m        17.544293  1.7505098  7.338659  0.13755240  5.389252
## Long.jump    15.293168  4.2904162  2.930094  1.62485936  7.748815
## Shot.put     13.060137  0.3967224 21.620432  2.01407269  8.824401
## High.jump     9.024811 11.7715838  8.792888  2.54987951 23.115504
## X400m        11.935544  4.5799296  6.487636 22.65090599  1.539012
## X110m.hurdle 14.157544  0.0332933 16.261261  0.03483735  7.166193
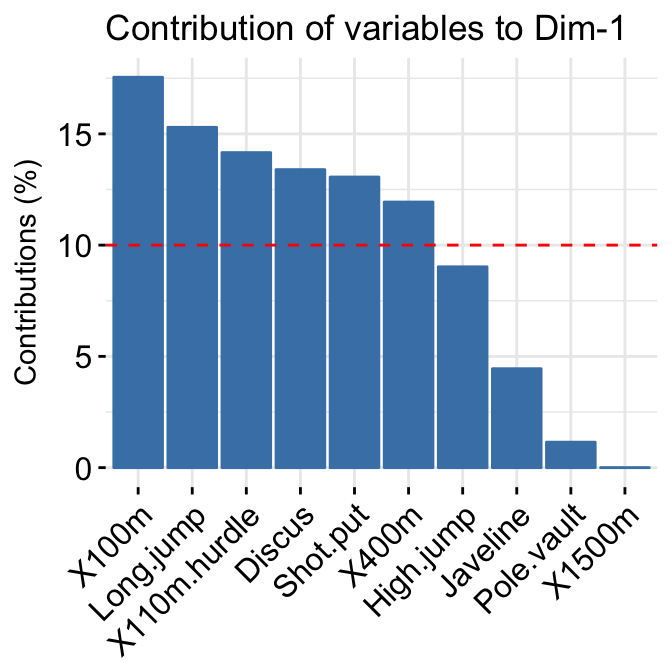
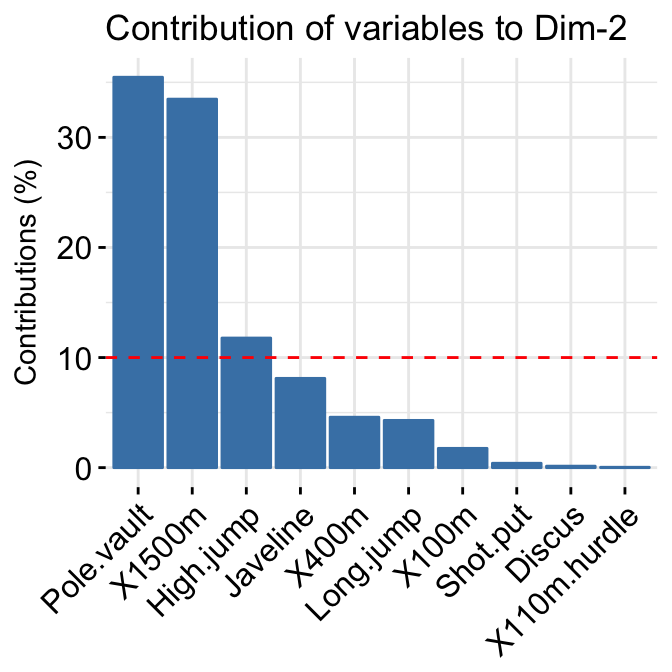
It’s possible to control variable colors using their contributions (“contrib”) to the principal axes:
- Variable contributions to the principal axes:
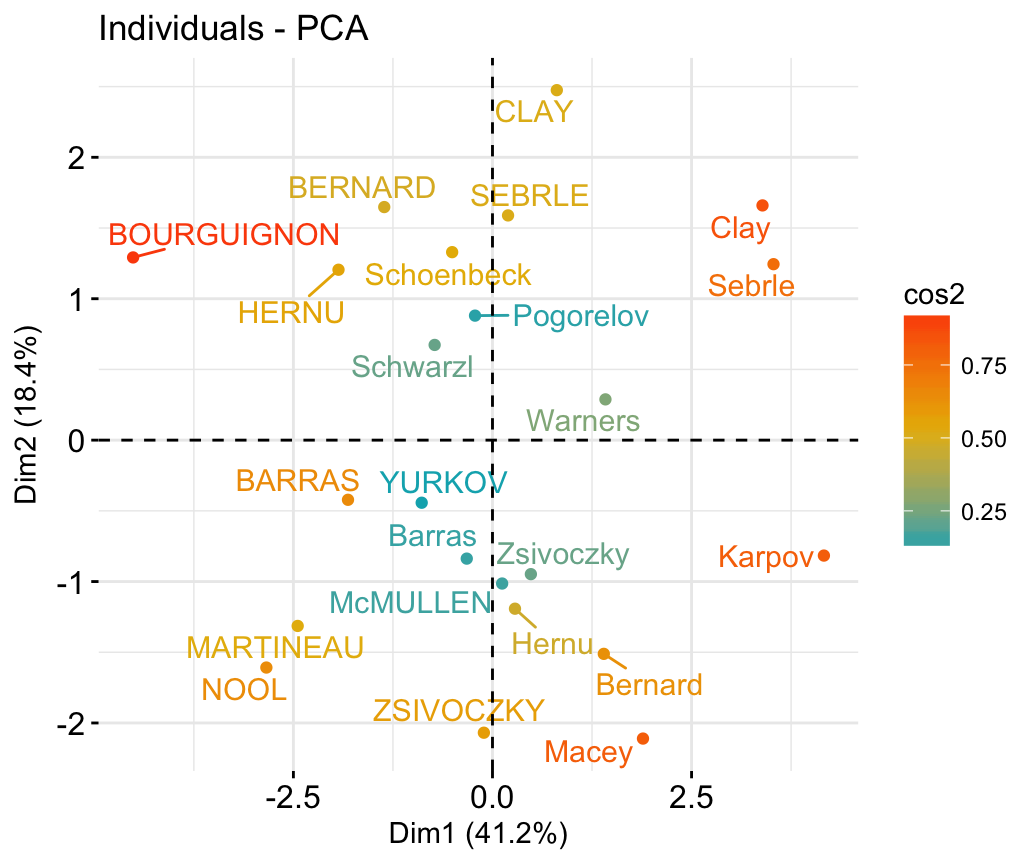
- Extract and visualize results for individuals:
## Principal Component Analysis Results for individuals
##  ===================================================
##   Name       Description
## 1 "$coord"   "Coordinates for the individuals"
## 2 "$cos2"    "Cos2 for the individuals"
## 3 "$contrib" "contributions of the individuals"
##                Dim.1      Dim.2      Dim.3       Dim.4       Dim.5
## SEBRLE     0.1955047  1.5890567  0.6424912  0.08389652  1.16829387
## CLAY       0.8078795  2.4748137 -1.3873827  1.29838232 -0.82498206
## BERNARD   -1.3591340  1.6480950  0.2005584 -1.96409420  0.08419345
## YURKOV    -0.8889532 -0.4426067  2.5295843  0.71290837  0.40782264
## ZSIVOCZKY -0.1081216 -2.0688377 -1.3342591 -0.10152796 -0.20145217
## McMULLEN   0.1212195 -1.0139102 -0.8625170  1.34164291  1.62151286
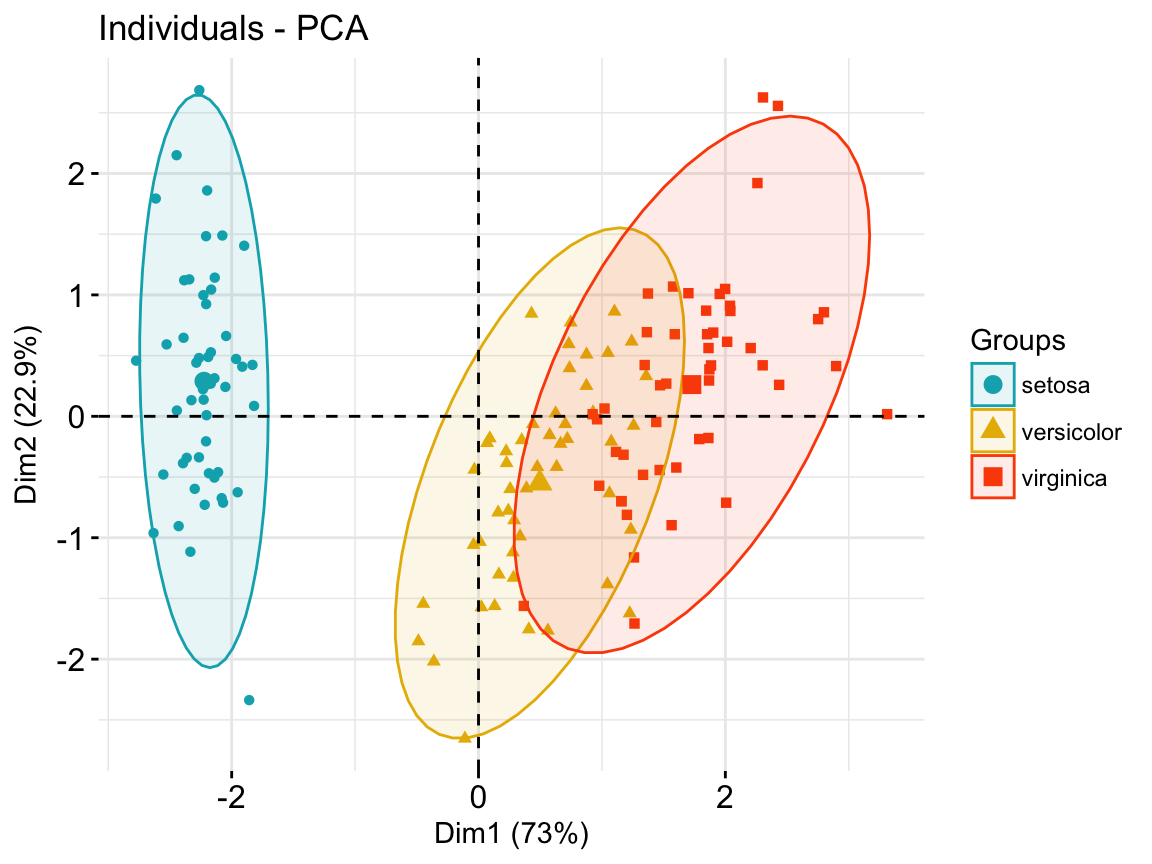
- Color individuals by groups:
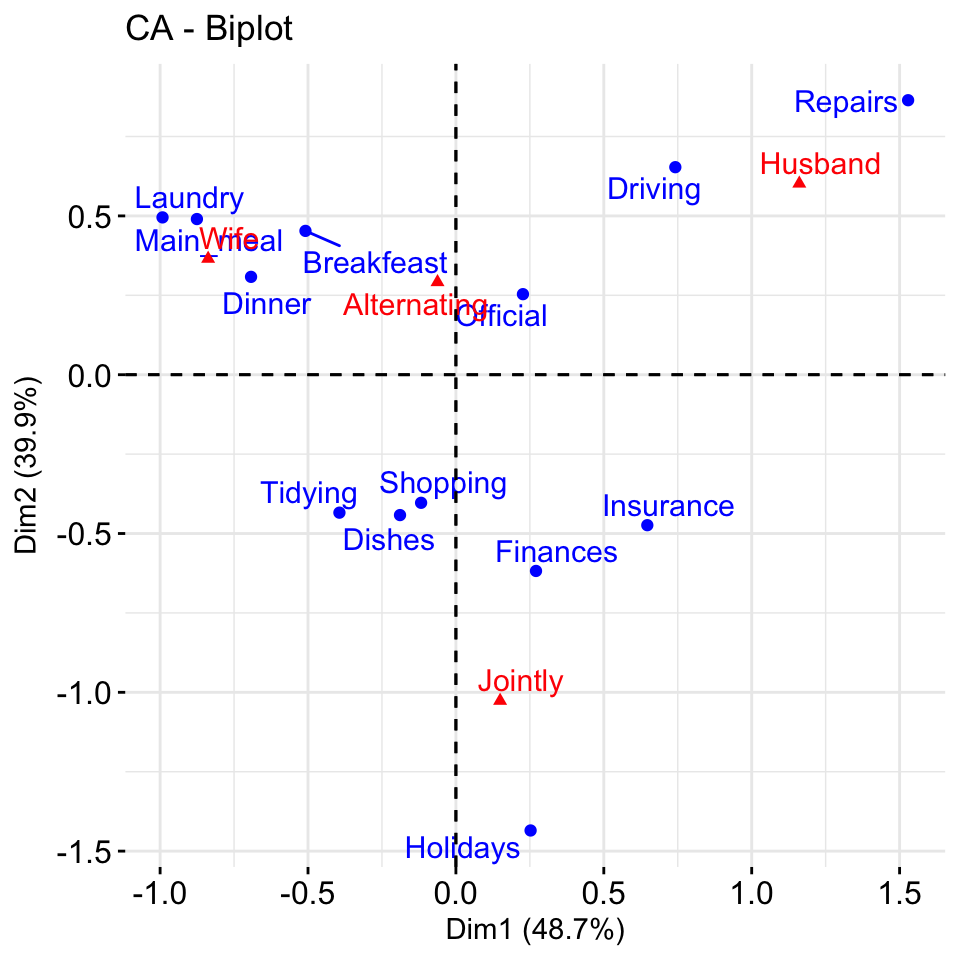
Correspondence analysis
- Data: housetasks [in factoextra]
- CA function FactoMineR::CA()
- Visualize with factoextra::fviz_ca()
Read more about computing and interpreting correspondence analysis at: Correspondence Analysis (CA).
- Extract results for row/column variables:
- Biplot of rows and columns
fviz_ca_biplot(res.ca, repel = TRUE)
To visualize only row points or column points, type this:
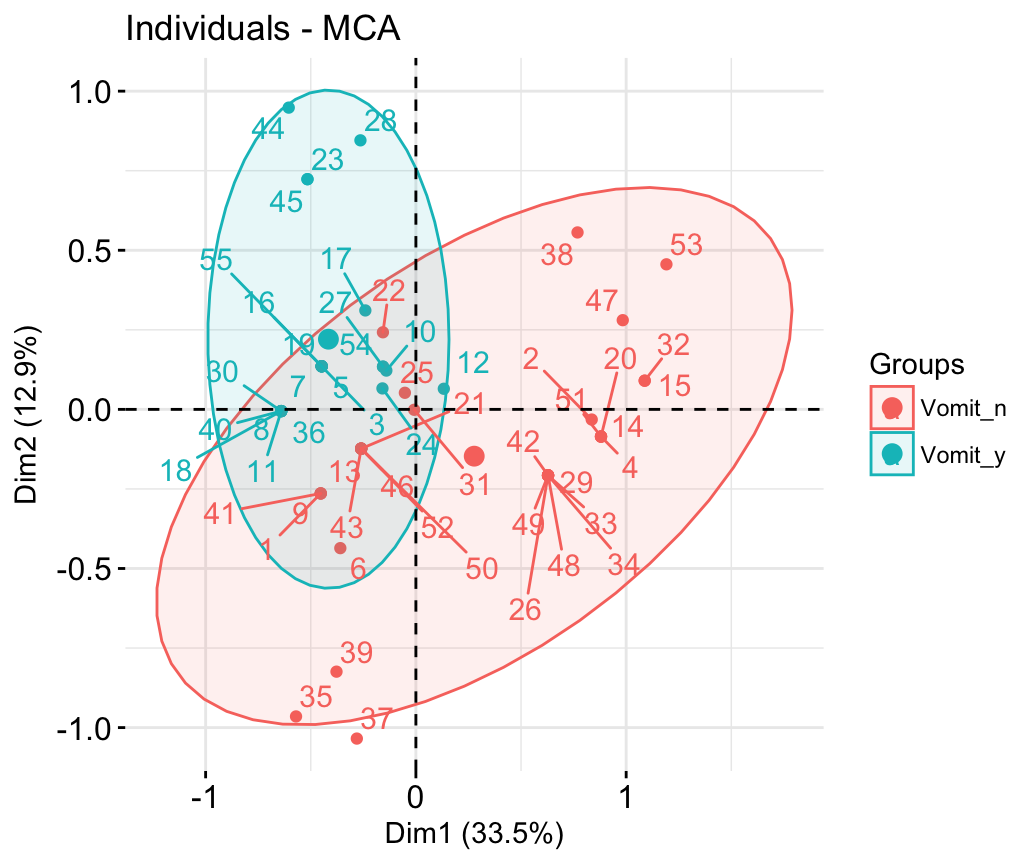
Multiple correspondence analysis
- Data: poison [in factoextra]
- MCA function FactoMineR::MCA()
- Visualization factoextra::fviz_mca()
Read more about computing and interpreting multiple correspondence analysis at: Multiple Correspondence Analysis(MCA).
- Computing MCA:
library(FactoMineR)
data(poison)
res.mca <- MCA(poison, quanti.sup = 1:2,
              quali.sup = 3:4, graph=FALSE)
- Extract results for variables and individuals:
- Contribution of variables and individuals to the principal axes:
- Graph of individuals
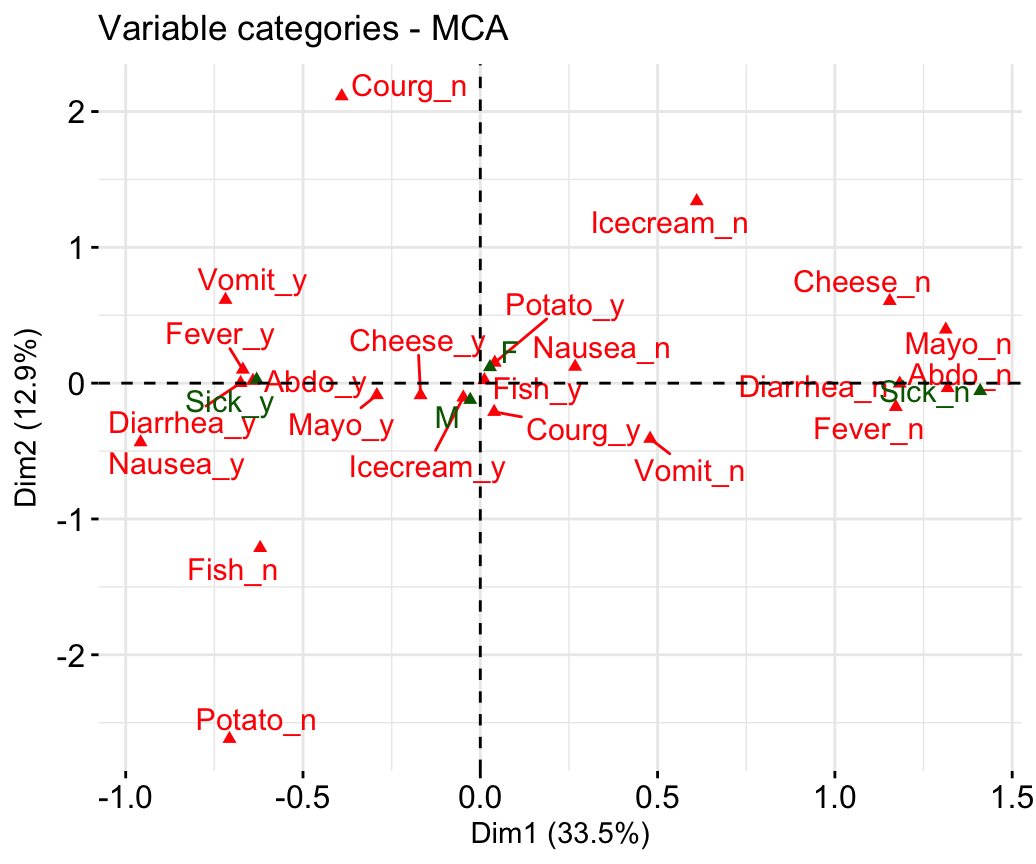
- Graph of variable categories:
fviz_mca_var(res.mca, repel = TRUE)
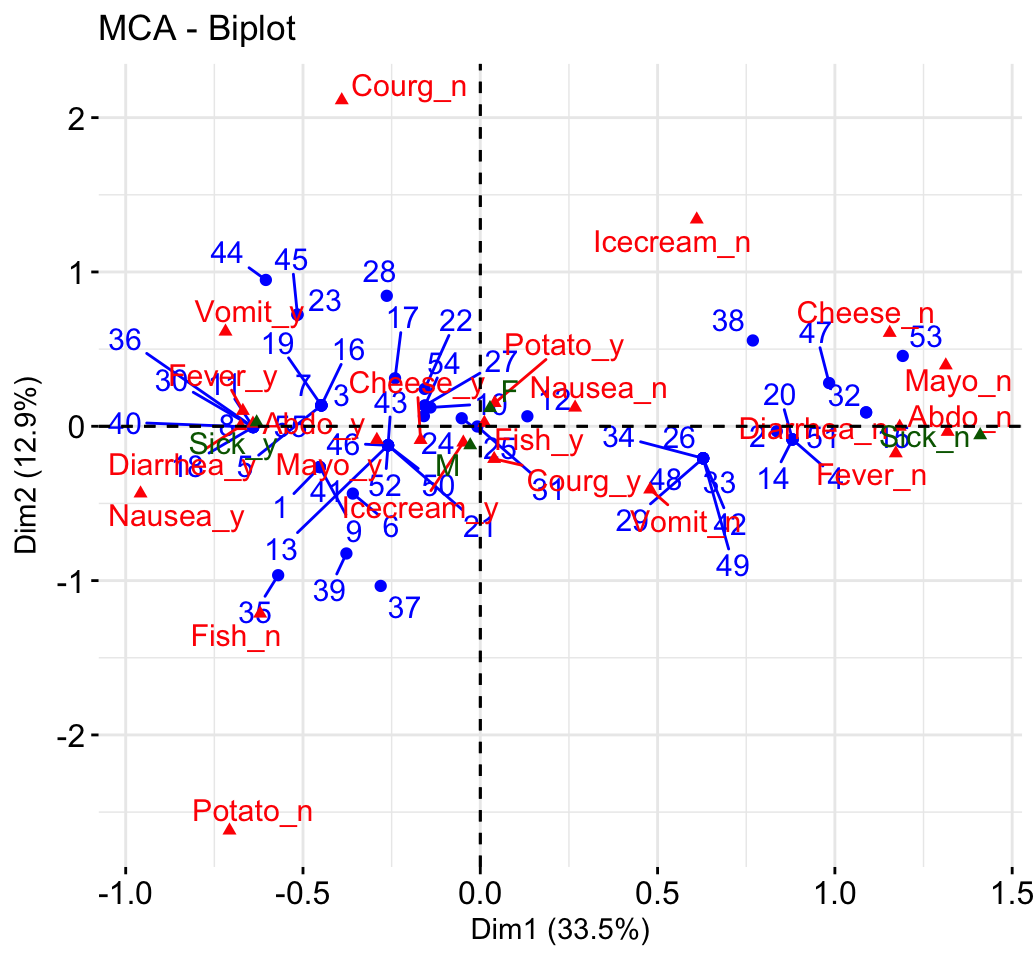
- Biplot of individuals and variables:
fviz_mca_biplot(res.mca, repel = TRUE)
Advanced methods
The factoextra R package has also functions that support the visualization of advanced methods such:
Acknoweledgment
I would like to thank Fabian Mundt for his active contributions to factoextra.
We sincerely thank all developers for their efforts behind the packages that factoextra depends on, namely, ggplot2 (Hadley Wickham, Springer-Verlag New York, 2009), FactoMineR (Sebastien Le et al., Journal of Statistical Software, 2008),dendextend (Tal Galili, Bioinformatics, 2015), cluster (Martin Maechler et al., 2016) and more …..
转自:http://www.sthda.com/english/wiki/factoextra-r-package-easy-multivariate-data-analyses-and-elegant-visualization