#--------------------------------------------------------------------#set tomcat path @olddoor### first tomcat ###CATALINA_BASE=/usr/apache/tomcat-7-1CATALINA_HOME=/usr/apache/tomcat-7-1TOMCAT_HOME=/usr/apache/tomcat-7-1export CATALINA_BASE CATALINA_HOME TOMCAT_HOME### second tomcat ###CATALINA_2_BASE=/usr/apache/tomcat-7-2CATALINA_2_HOME=/usr/apache/tomcat-7-2TOMCAT_2_HOME=/usr/apache/tomcat_7-2export CATALINA_2_BASE CATALINA_2_HOME TOMCAT_2_HOME### third tomcat ###CATALINA_3_BASE=/usr/apache/tomcat-7-3CATALINA_3_HOME=/usr/apache/tomcat-7-3TOMCAT_HOME=/usr/apache/tomcat-7-3export CATALINA_3_BASE CATALINA_3_HOME TOMCAT_3_HOME#set java path--------------------------------------------------------JAVA_HOME=/usr/java/jdk1.7export JRE_HOME=$JAVA_HOME/jreexport CLASSPATH=$JAVA_HOME/lib:$JRE_HOME/lib:$CLASSPATHexport PATH=$JAVA_HOME/bin:$JRE_HOME/bin:$PATH
export JAVA_HOME=export PATH=export CLASSPATH=###以上三个环境变量就是JAVA的环境变量可以不写###export CATALINA_BASE=$CATALINA_2_BASE #配置对应的tomcat变量即可export CATALINA_HOME=$CATALINA_2_HOME
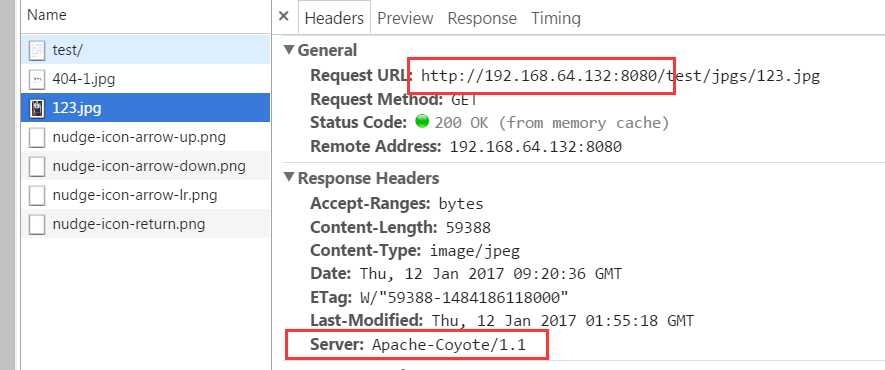
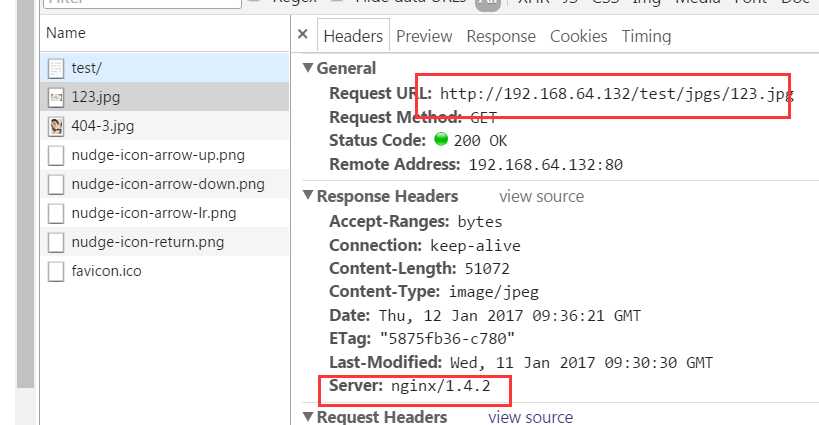
<html><head><meta http-equiv="Content-Type" content="text/html; charset=ISO-8859-1"><title>Insert title here</title></head><body>hello<br/><img id="img1" src=/test/static/404-1.jpg /><img id="img1" src=/test/jpgs/123.jpg /></body></html>


#user nobody; # user root root #Nginx所在的用户和用户组user root root; #Nginx所在的用户和用户组worker_processes 1;# 启动的工作进程数量#错误日志存放路径#error_log logs/error.log;#error_log logs/error.log notice;#error_log logs/error.log info;error_log logs/error.log info; #add by olddoor-----------#pid logs/nginx.pid;#add by olddoor-----------#add end------------------events {worker_connections 1024;}http {include mime.types;default_type application/octet-stream;#定义日志格式#log_format main ‘$remote_addr - $remote_user [$time_local] "$request" ‘# ‘$status $body_bytes_sent "$http_referer" ‘# ‘"$http_user_agent" "$http_x_forwarded_for"‘;#access_log logs/access.log main;sendfile on;#tcp_nopush on;#keepalive_timeout 0;keepalive_timeout 65;#gzip on;#add by olddor---------------------upstream localhost {#发到localhost上的请求,通过Nginx转发到实际处理请求的服务器server 192.168.64.132:8080 weight=1;server 192.168.64.132:8081 weight=1;server 192.168.64.132:8082 weight=1;}#add by olddor over----------------server {listen 80;server_name localhost;#charset koi8-r;#access_log logs/host.access.log main;location / {proxy_connect_timeout 3; #add by olddoorproxy_send_timeout 30; #add by olddoorproxy_read_timeout 30; #add by olddoorproxy_pass http://localhost; #add by olddoor#root html; #ignore by olddoor#index index.html index.htm; #ignore by olddoor}location /test/jpgs/ {alias /data/imgs/;}#location /jpgs#error_page 404 /404.html;# redirect server error pages to the static page /50x.html#error_page 500 502 503 504 /50x.html;location = /50x.html {root html;}# deny access to .htaccess files, if Apache‘s document root# concurs with nginx‘s one##location ~ /\.ht {# deny all;#}}# another virtual host using mix of IP-, name-, and port-based configuration##server {# listen 8000;# listen somename:8080;# server_name somename alias another.alias;# location / {# root html;# index index.html index.htm;# }#}# HTTPS server##server {# listen 443;# server_name localhost;# ssl on;# ssl_certificate cert.pem;# ssl_certificate_key cert.key;# ssl_session_timeout 5m;# ssl_protocols SSLv2 SSLv3 TLSv1;# ssl_ciphers HIGH:!aNULL:!MD5;# ssl_prefer_server_ciphers on;# location / {# root html;# index index.html index.htm;# }#}}


apt-get install apache2-utils
yum install httpd-tools
#用于描述每个请求处理时间的分布情况,例如:50% 28 50%请求处理时间不超过28毫秒 (这里所指的处理时间是指:Time per request )Percentage of the requests served within a certain time (ms)50% 2866% 3275% 3480% 3590% 5395% 6298% 6599% 66100% 1823 (longest request)second表示当前测试的服务器每秒可以处理16.54个静态html的请求事务,后面的mean表示平均。这个数值表示当前机器的整体性能,值越大越好。 Requests per second: 547.04 [#/sec] (mean) Time per request: 1828.016 [ms] (mean) Time per request: 1.828 [ms] (mean, across all concurrent requests) Transfer rate: 76.93 [Kbytes/sec] received
Percentage of the requests served within a certain time (ms)50% 10766% 20175% 24380% 25790% 33495% 36098% 111699% 1117100% 1118 (longest request)second表示当前测试的服务器每秒可以处理16.54个静态html的请求事务,后面的mean表示平均。这个数值表示当前机器的整体性能,值越大越好。 Requests per second: 873.38 [#/sec] (mean) Time per request: 1144.983 [ms] (mean) Time per request: 1.145 [ms] (mean, across all concurrent requests) Transfer rate: 216.83 [Kbytes/sec] received
This is ApacheBench, Version 2.3 <$Revision: 1528965 $>Copyright 1996 Adam Twiss, Zeus Technology Ltd, http://www.zeustech.net/Licensed to The Apache Software Foundation, http://www.apache.org/Benchmarking localhost (be patient)Total of 9967 requests completed
- Server Software: nginx/1.4.2
Server Hostname: localhostServer Port: 80- Concurrency Level: 1000
Time taken for tests: 1.145 secondsComplete requests: 1000Failed requests: 551(Connect: 0, Receive: 0, Length: 551, Exceptions: 0)Non-2xx responses: 1000Keep-Alive requests: 0Total transferred: 254220 bytesHTML transferred: 105792 bytessecond表示当前测试的服务器每秒可以处理16.54个静态html的请求事务,后面的mean表示平均。这个数值表示当前机器的整体性能,值越大越好。Requests per second: 873.38 [#/sec] (mean)Time per request: 1144.983 [ms] (mean)Time per request: 1.145 [ms] (mean, across all concurrent requests)Transfer rate: 216.83 [Kbytes/sec] receivedConnection Times (ms)min mean[+/-sd] median maxConnect: 16 26 4.6 27 33Processing: 16 155 174.5 88 1101Waiting: 13 155 174.6 88 1101Total: 44 181 172.5 107 1118Percentage of the requests served within a certain time (ms)50% 10766% 20175% 24380% 25790% 33495% 36098% 111699% 1117100% 1118 (longest request)
ab -kc 1000 -n 1000 http://192.168.64.132:80/test/ |tee /usr/111.txt #将结果保存到/usr/111.txt中
原文:http://www.cnblogs.com/redcoatjk/p/6279225.html