上代码:
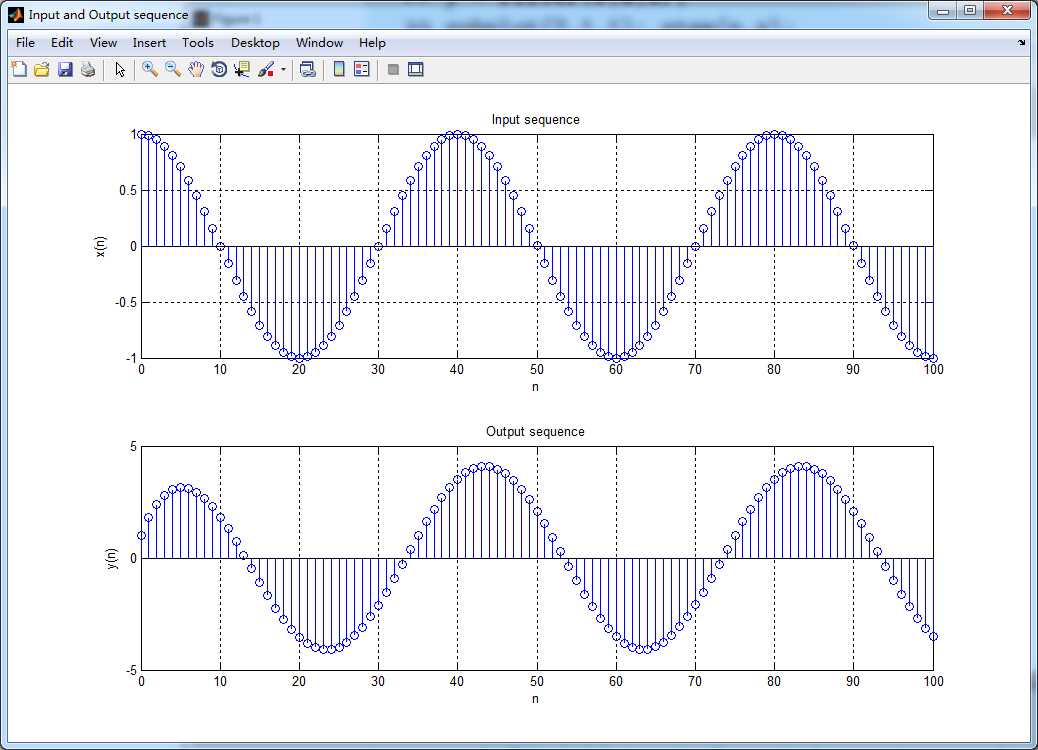
subplot(1,1,1);
b = 1; a = [1, -0.8];
n = [0:100]; x = cos(0.05*pi*n);
y = filter(b,a,x);

figure(‘NumberTitle‘, ‘off‘, ‘Name‘, ‘Input and Output sequence‘);
set(gcf,‘Color‘,‘white‘);
subplot(2,1,1); stem(n,x); title(‘Input sequence‘);  xlabel(‘n‘); ylabel(‘x(n)‘); grid on;
subplot(2,1,2); stem(n,y); title(‘Output sequence‘); xlabel(‘n‘); ylabel(‘y(n)‘); grid on;
结果:
DSP using MATLAB 示例 Example3.15
原文:http://www.cnblogs.com/ky027wh-sx/p/6078865.html