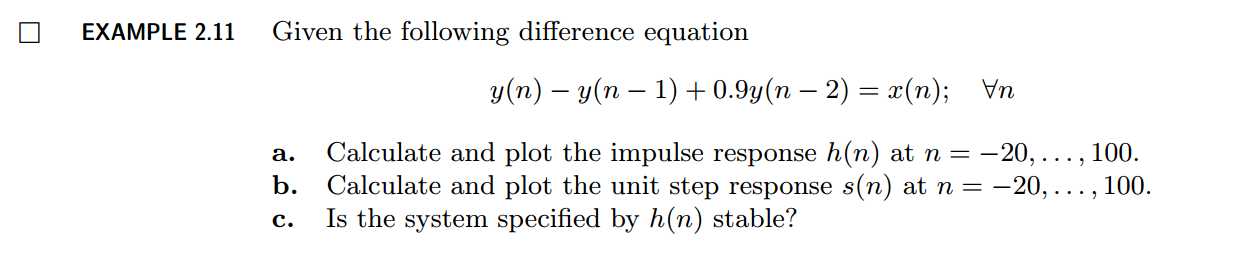
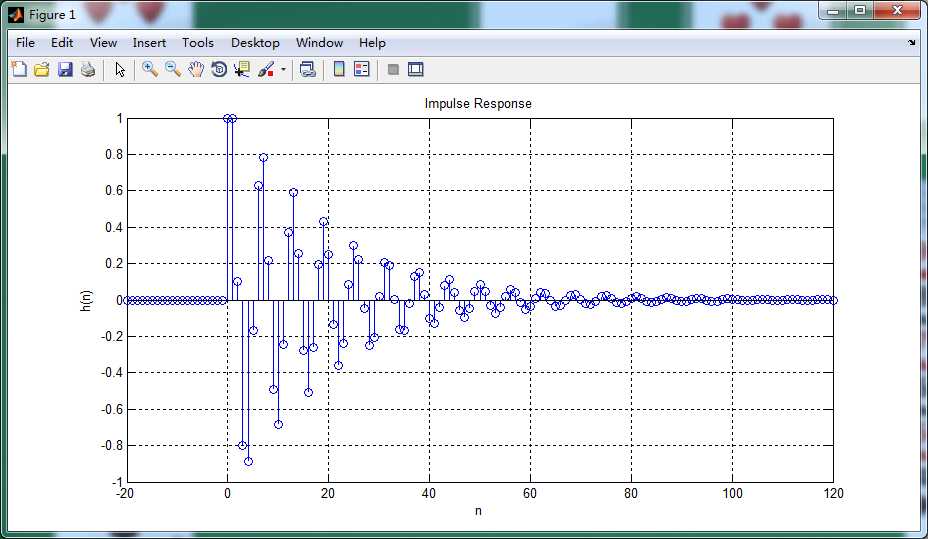
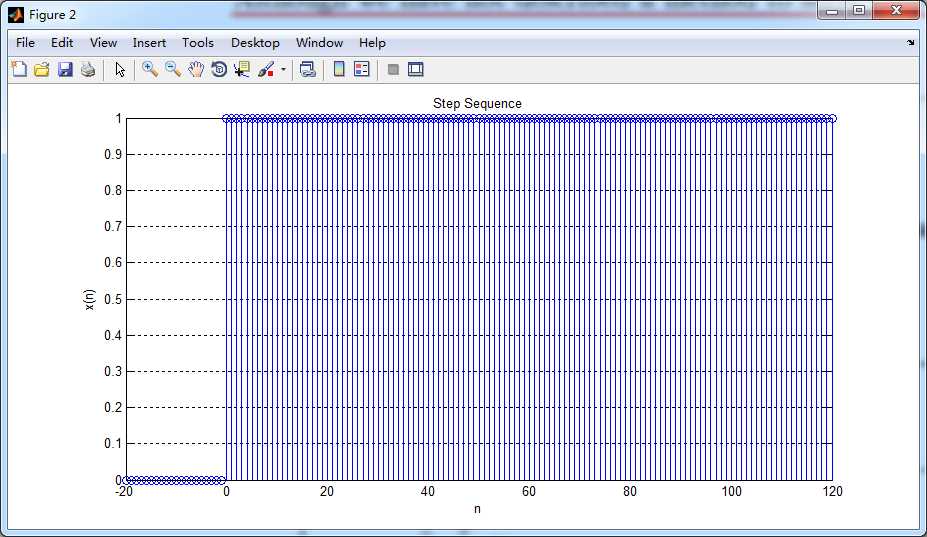
上代码:
b = [1]; a = [1, -1, 0.9]; n = [-20:120];
h = impz(b,a,n);

set(gcf,‘Color‘,‘white‘);
%subplot(2,1,1);
stem(n,h); title(‘Impulse Response‘);
xlabel(‘n‘); ylabel(‘h(n)‘); grid on;


x = stepseq(0,-20, 120); s = filter(b,a,x);
figure; set(gcf,‘Color‘,‘white‘);
%subplot(2, 1,2);
stem(n,x); title(‘Step Sequence‘);
xlabel(‘n‘); ylabel(‘x(n)‘); grid on;


figure; set(gcf,‘Color‘,‘white‘);
%subplot(2, 1,2);
stem(n,s); title(‘Step Response‘);
xlabel(‘n‘); ylabel(‘s(n)‘); grid on;
结果:
DSP using MATLAB 示例Example2.11
原文:http://www.cnblogs.com/ky027wh-sx/p/6028944.html