
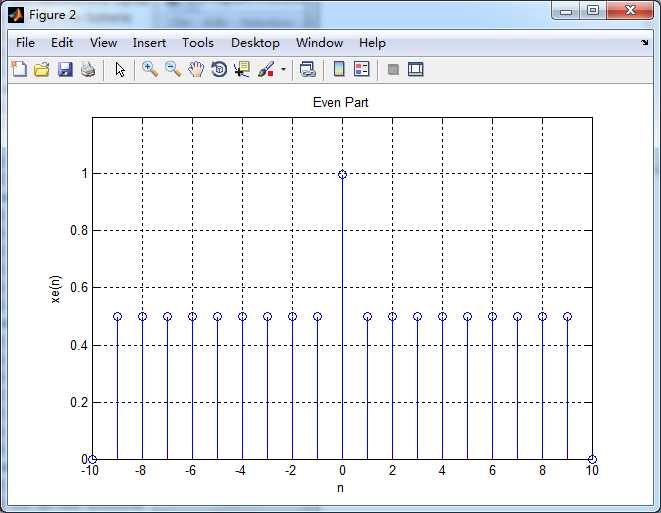
n = [0:10]; x = stepseq(0,0,10) - stepseq(10,0,10);
[xe,xo,m] = evenodd(x,n);

set(gcf,‘Color‘,[1,1,1])                  % 改变坐标外围背景颜色
stem(n,x); title(‘Rectangular Pulse‘);
xlabel(‘n‘); ylabel(‘x(n)‘) ; axis([-10,10,0,1.2])
grid on

figure
set(gcf,‘Color‘,[1,1,1])
stem(m,xe); title(‘Even Part‘);
xlabel(‘n‘); ylabel(‘xe(n)‘); axis([-10,10,0,1.2])
grid on

figure
set(gcf,‘Color‘,‘white‘)
stem(m,xo); title(‘Odd Part‘);
xlabel(‘n‘); ylabel(‘xe(n)‘); axis([-10,10,-0.6,0.6])
grid on
结果:


原文:http://www.cnblogs.com/ky027wh-sx/p/6014635.html