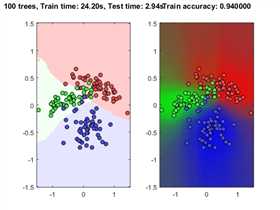
之前建立了一个SVM-based Ordinal regression模型,一种特殊的多分类模型,就想通过可视化的方式展示模型分类的效果,对各个分类区域用不同颜色表示。可是,也看了很多代码,但基本都是展示二分类,当扩展成多分类时就会出现问题,所以我的论文最后就只好画了boundary的图了。今天在研究Random Forest时,找到了下面的demo的MATLAB代码,该代码很好的实现了各分类区域的颜色填充,效果非常漂亮。
下面是一个Demo代码:Demo.m
%% generate data
prettySpiral = true;
if ~prettySpiral
% generate some random gaussian like data
rand(‘state‘, 0);
randn(‘state‘, 0);
N= 50;
D= 2;
X1 = mgd(N, D, [4 3], [2 -1;-1 2]);
X2 = mgd(N, D, [1 1], [2 1;1 1]);
X3 = mgd(N, D, [3 -3], [1 0;0 4]);
X= [X1; X2; X3];
X= bsxfun(@rdivide, bsxfun(@minus, X, mean(X)), var(X));
Y= [ones(N, 1); ones(N, 1)*2; ones(N, 1)*3];
scatter(X(:,1), X(:,2), 20, Y)
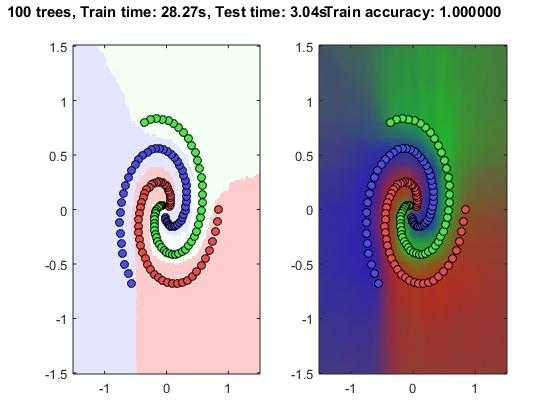
else
% generate twirl data!
N= 50;
t = linspace(0.5, 2*pi, N);
x = t.*cos(t);
y = t.*sin(t);
t = linspace(0.5, 2*pi, N);
x2 = t.*cos(t+2);
y2 = t.*sin(t+2);
t = linspace(0.5, 2*pi, N);
x3 = t.*cos(t+4);
y3 = t.*sin(t+4);
X= [[x‘ y‘]; [x2‘ y2‘]; [x3‘ y3‘]];
X= bsxfun(@rdivide, bsxfun(@minus, X, mean(X)), var(X));
Y= [ones(N, 1); ones(N, 1)*2; ones(N, 1)*3];
scatter(X(:,1), X(:,2), 20, Y)
end
%% classify
rand(‘state‘, 0);
randn(‘state‘, 0);
opts= struct;
opts.depth= 9;
opts.numTrees= 100;
opts.numSplits= 5;
opts.verbose= true;
opts.classifierID= 2; % weak learners to use. Can be an array for mix of weak learners too
tic;
m= forestTrain(X, Y, opts);
timetrain= toc;
tic;
yhatTrain = forestTest(m, X);
timetest= toc;
% Look at classifier distribution for fun, to see what classifiers were
% chosen at split nodes and how often
fprintf(‘Classifier distributions:\n‘);
classifierDist= zeros(1, 4);
unused= 0;
for i=1:length(m.treeModels)
for j=1:length(m.treeModels{i}.weakModels)
cc= m.treeModels{i}.weakModels{j}.classifierID;
if cc>1 %otherwise no classifier was used at that node
classifierDist(cc)= classifierDist(cc) + 1;
else
unused= unused+1;
end
end
end
fprintf(‘%d nodes were empty and had no classifier.\n‘, unused);
for i=1:4
fprintf(‘Classifier with id=%d was used at %d nodes.\n‘, i, classifierDist(i));
end
%% plot results
xrange = [-1.5 1.5];
yrange = [-1.5 1.5];
inc = 0.02;
[x, y] = meshgrid(xrange(1):inc:xrange(2), yrange(1):inc:yrange(2));
image_size = size(x);
xy = [x(:) y(:)];
[yhat, ysoft] = forestTest(m, xy);
decmap= reshape(ysoft, [image_size 3]);
decmaphard= reshape(yhat, image_size);
subplot(121);
imagesc(xrange,yrange,decmaphard);
hold on;
set(gca,‘ydir‘,‘normal‘);
cmap = [1 0.8 0.8; 0.95 1 0.95; 0.9 0.9 1];
colormap(cmap);
plot(X(Y==1,1), X(Y==1,2), ‘o‘, ‘MarkerFaceColor‘, [.9 .3 .3], ‘MarkerEdgeColor‘,‘k‘);
plot(X(Y==2,1), X(Y==2,2), ‘o‘, ‘MarkerFaceColor‘, [.3 .9 .3], ‘MarkerEdgeColor‘,‘k‘);
plot(X(Y==3,1), X(Y==3,2), ‘o‘, ‘MarkerFaceColor‘, [.3 .3 .9], ‘MarkerEdgeColor‘,‘k‘);
hold off;
title(sprintf(‘%d trees, Train time: %.2fs, Test time: %.2fs\n‘, opts.numTrees, timetrain, timetest));
subplot(122);
imagesc(xrange,yrange,decmap);
hold on;
set(gca,‘ydir‘,‘normal‘);
plot(X(Y==1,1), X(Y==1,2), ‘o‘, ‘MarkerFaceColor‘, [.9 .3 .3], ‘MarkerEdgeColor‘,‘k‘);
plot(X(Y==2,1), X(Y==2,2), ‘o‘, ‘MarkerFaceColor‘, [.3 .9 .3], ‘MarkerEdgeColor‘,‘k‘);
plot(X(Y==3,1), X(Y==3,2), ‘o‘, ‘MarkerFaceColor‘, [.3 .3 .9], ‘MarkerEdgeColor‘,‘k‘);
hold off;
title(sprintf(‘Train accuracy: %f\n‘, mean(yhatTrain==Y)));
以上具体代码见:https://github.com/karpathy/Random-Forest-Matlab
多分类问题中,实现不同分类区域颜色填充的MATLAB代码(demo:Random Forest)
原文:http://www.cnblogs.com/huadongw/p/5248355.html