网上关于ELk的搭建有很多,下面是我搭建的过程,记录下来。
# vim /etc/sysconfig/iptables
-A INPUT -m state --state NEW -m tcp -p tcp --dport 80 -j ACCEPT
-A INPUT -m state --state NEW -m tcp -p tcp --dport 9200 -j ACCEPT
-A INPUT -m state --state NEW -m tcp -p tcp --dport 9292 -j ACCEPT
# service iptables restart
http.cors.enabled: true #233行
wget https://github.com/elasticsearch/elasticsearch-servicewrapper/archive/master.tar.gz
mv elasticsearch-servicewrapper-master/service/ /usr/local/elasticsearch/bin/
/usr/local/elasticsearch/bin/service/elasticsearch start
三、搭建logstash
3.1 下载地址:
wget https://download.elasticsearch.org/logstash/logstash/logstash-1.4.2.tar.gz
3.2 tar xfz logstash-1.4.2.tar.gz
3.3 ln -s logstash-1.4.2 logstash
3.4 测试
/usr/local/logstash/bin/logstash -e ‘input { stdin { } } output { stdout {} }‘
3.5 mkdir /usr/local/logstash/etc
3.6 创建配置文件
vim /usr/local/logstash/etc/logstash_agent.conf
input {
  file {
    type => "http.access"
    path => ["/var/log/httpd/access_log"]
  }

  file {
    type => "http.error"
    path => ["/var/log/httpd/error_log"]
  }

  file {
    type => "messages"
    path => ["/var/log/messages"]
  }
}

output {
  elasticsearch {
    host => "192.168.241.144"
    port => 9300
  }
}
3.7 启动服务
集群存放路径:/export/search/elasticsearch-cluster
1. 解压tar包,创建集群节点
#进入到集群路径
[root@localhost elasticsearch-cluster]# pwd
/export/search/elasticsearch-cluster
#重命名解压包
[root@localhost elasticsearch-cluster]# ls
elasticsearch-1.4.1
[root@localhost elasticsearch-cluster]# mv elasticsearch-1.4.1 elasticsearch-node1#进入到节点配置路径
[root@localhost elasticsearch-cluster]# cd elasticsearch-node1/config/
[root@localhost config]# ls
elasticsearch.yml  logging.yml
2.创建集群配置信息:
# elasticsearch-node1配置# 配置集群名称
cluster.name: elasticsearch-cluster-centos
# 配置节点名称
node.name: "es-node1"# 为节点之间的通信设置一个自定义端口(默认为9300)
transport.tcp.port: 9300
# 设置监听HTTP传输的自定义端(默认为9200)
http.port: 9200
elasticsearch配置文件说明见: http://blog.csdn.net/an74520/article/details/10175603
3.安装head插件
#进入到节点bin路径
[root@localhost bin]# pwd
/export/search/elasticsearch-cluster/elasticsearch-node1/bin
安装插件
[root@localhost bin]# ./plugin -install mobz/elasticsearch-head
安装完插件之后会在es节点bin路径同级创建一个plugins目录,存放安装的插件
4.复制一份配置好的节点为elasticsearch-node2
[root@localhost elasticsearch-cluster]# ls
elasticsearch-node1  elasticsearch-node2
5.修改节点2中的集群配置信息
# elasticsearch-node2配置# 配置集群名称
cluster.name: elasticsearch-cluster-centos
# 配置节点名称
node.name: "es-node2"# 为节点之间的通信设置一个自定义端口(默认为9300)
transport.tcp.port: 9301
# 设置监听HTTP传输的自定义端(默认为9200)
http.port: 9201
说明:
上面配置表示集群中有2个节点,节点名为别为,"es-node1"和 "es-node2",同属于集群"elasticsearch-cluster-centos"
节点二中端口可以不用配置,es在启动时会去检测,如果目标端口被占用,会检测下一个端口.因为两节点部署在同一天虚拟机上为了更好的说明问题,这里手动配置了对应的端口.
我们可以从es对应日志中()查看对应的启动信息,以及端口绑定信息。
6.分别启动节点
[root@localhost bin]# pwd
/export/search/elasticsearch-cluster/elasticsearch-node1/bin
[root@localhost bin]# ./elasticsearch -d -Xms512m -Xmx512m
如上,为启动节点1的命令,es启动配置相关日志查看elasticsearch-cluster- centos.log即可.
[root@localhost logs]# pwd
/export/search/elasticsearch-cluster/elasticsearch-node2/logs
[root@localhost logs]# ls
elasticsearch-cluster-centos_index_indexing_slowlog.log  elasticsearch-cluster-centos.log  elasticsearch-cluster-centos_index_search_slowlog.log
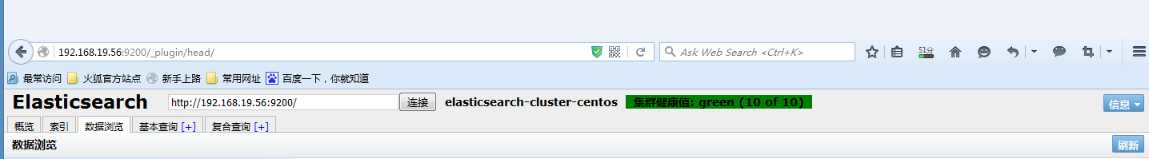
7. 至此我们的简易集群配置完成.查看集群
因为我们安装了head插件,所以可以通过该插件查看,虚拟机ip为192.168.19.56.
http://192.168.19.56:9200/_plugin/head/ (对应节点1)
http://192.168.19.56:9201/_plugin/head/ (对应节点2)
原文:http://www.cnblogs.com/nika86/p/5222386.html